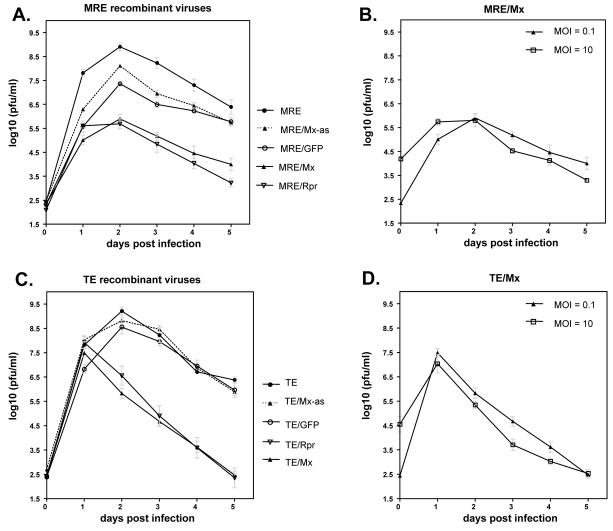
Figure 7.
Non-cumulative virus growth curves in C6/36 cells. Cells were infected with the indicated viruses at m.o.i. of 0.1 (A and C), and 0.1 or 10 (B and D). The cells were washed three times with PBS after harvesting each time point. Data are shown as mean ± SEM of four experiments. The treatments in panels A and C differed significantly by two way ANOVA (p < 0.0001) while differences between treatments in panels B and D were not significant.

