
Figure 4.
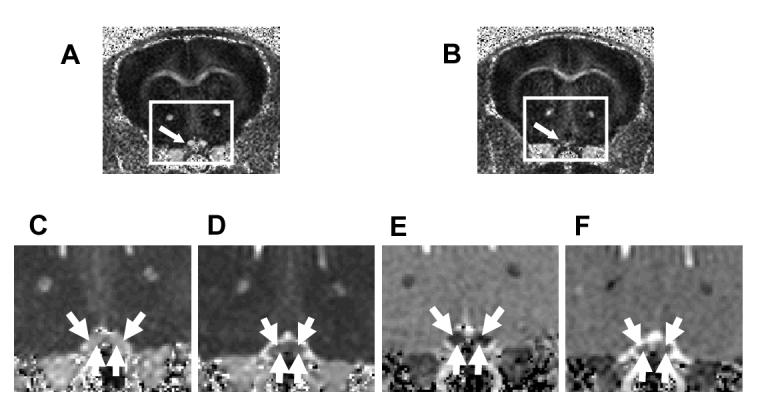
Optic nerves (indicated by arrows) from the EAE-affected mouse appears hypointense (B) in RA maps, comparing to the control (A). Decreased λ∥ (D) and increased λ⊥ (F) in optic nerves from EAE-affected mice were observed in the expanded views of λ∥ (C and D) and λ⊥ (E and F) corresponding to the rectangles in (A) and (B). (Reproduced from Sun et al. 55 Figures 2 and 3 with modification.)