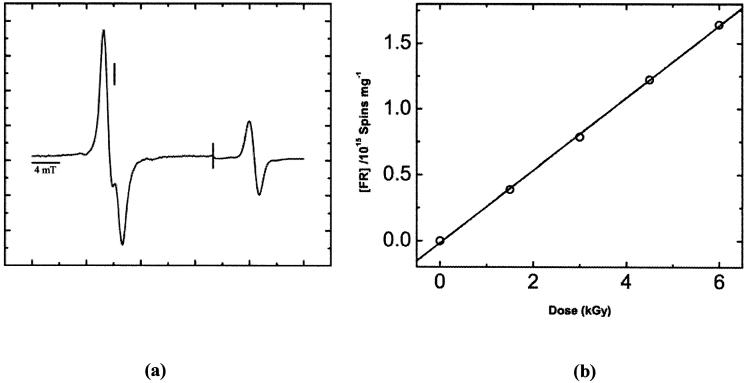
FIG. 1.
Panel a: First-derivative, Q-band, EPR spectrum of d(CGCGCG)2 films at Γ= 2.5, X-irradiated with a dose of 6 kGy and recorded at 4 K. The spectral width was 40 mT. The scan was paused after recording the DNA signal, then the field sweep center was increased by 20 mT and the signal gain adjusted, then the sweep was continued to record the ruby reference signal. The vertical line corresponds to the position of g = 2.0022. The microwave power attenuation was 50 dB, delivering 0.3 nW to the cavity. Panel b: Free radical dose-response data showing the linear fit used to calculate the chemical yield, G(Σfr).

