
FIG. 11.
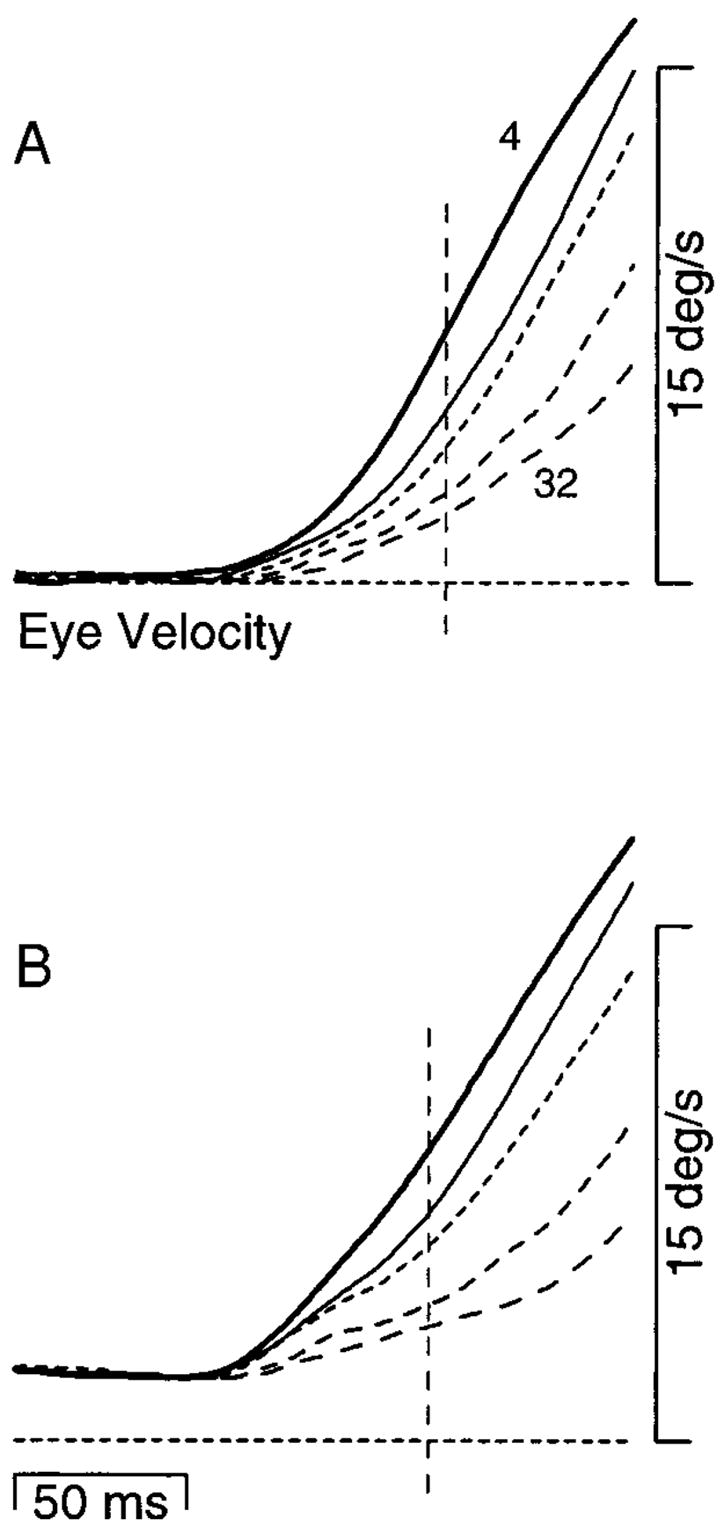
Effect of initial target velocity on responses to a 30°/s step of apparent target velocity using multiple values of Δt. A: initial target velocity was 0°/s and the step took target velocity to 30°/s. B: initial target velocity was 2°/s and the step took target velocity to 32°/s. Different trace types show average eye velocity for different values of Δt: bold traces, 4 ms; thin traces, 12 ms; small dashes, 16 ms; medium dashes, 24 ms; long dashes, 32 ms. The horizontal dashed lines mark 0°/s. Vertical dashed lines are placed 50 ms after the start of the response when Δt was 4 ms and show when the eye velocity measurements plotted in Fig. 12 were made.