
FIG. 12.
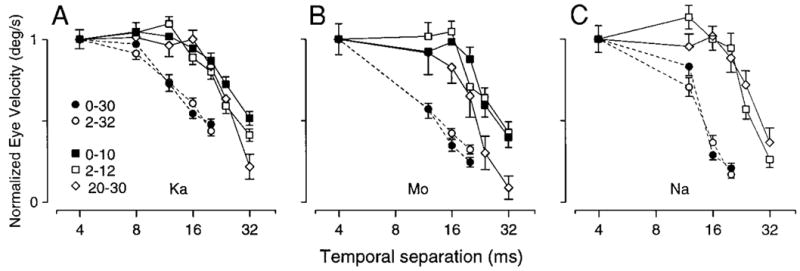
Quantitative analysis of the effect of initial target/eye velocity on the response to steps of target velocity as a function of Δt. The 3 graphs show data from 3 monkeys. Each graph plots the normalized eye velocity response as a function of Δt for steps of apparent target velocity imposed both at the initiation and during maintenance of pursuit. Each response was normalized by dividing the mean eye velocity response by that for the same conditions when Δt was 4 ms. When steps of target velocity were imposed at the initiation of pursuit, we measured eye velocity 50 ms after the onset of the response when Δt was 4 ms. When steps of target velocity were imposed during the maintenance of pursuit, we measured the change in eye velocity by subtracting eye velocity 10 ms before the start of the response from that measured 50 ms after. Different symbols indicate different initial target velocities and velocity step sizes. Filled symbols plot responses to target steps imposed during fixation of a stationary target: 10°/s (filled squares) and 30°/s (filled circles). Open symbols plot responses to target velocity steps imposed during pursuit of a moving target: from 2 to 32°/s (open circles), from 2 to 12°/s (open squares), and from 20 to 30°/s (open diamonds). Error bars show the standard error of the mean.