
FIG. 7.
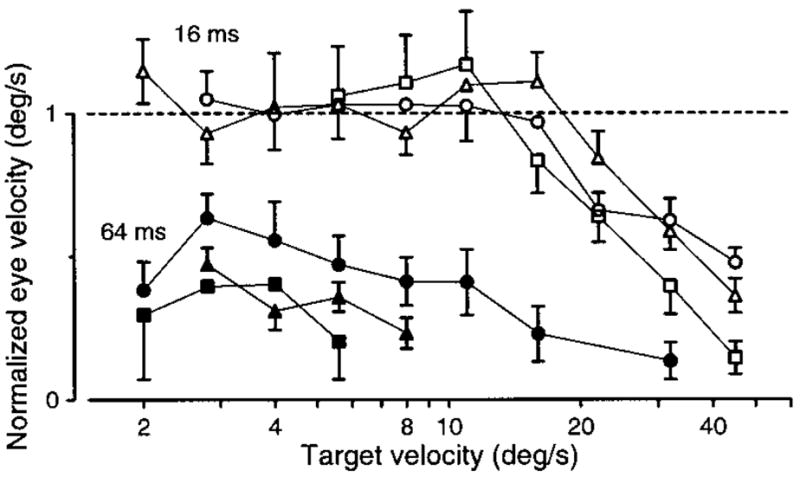
Effect of varying apparent target velocity on the initiation of pursuit at 2 values of Δt. The y-axis plots normalized average eye velocity measured 50 ms after the initiation of normal pursuit. The time of initiation of normal pursuit was measured when Δt was 4 ms and was measured separately for each apparent velocity. The average eye velocity for a given Δt is normalized by the average eye velocity for normal pursuit; i.e., when Δt was 4 ms. The horizontal dashed line shows a normalized eye velocity of one, which would indicate that eye velocity was the same as when Δt was 4 ms. Values below the dashed line indicate deficits. Open and filled symbols show responses when Δt was 16 and 64 ms. Different symbol shapes show data for monkeys Mo (triangles), Na (squares), and Ka (circles). Error bars show the standard error of the mean. Overlapping error bars have been suppressed.