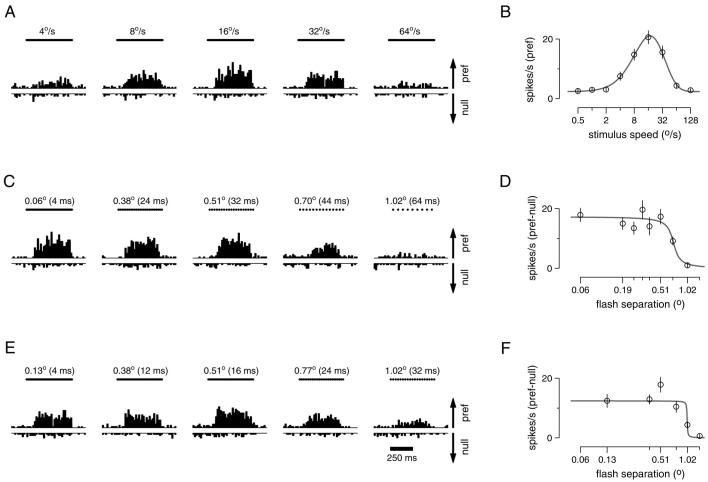
FIG. 1.
Responses of an example primary visual cortex (V1) neuron to different stimulus speeds (A and B) and to different flash separations (C-F). A: histograms (bin width = 20 ms) showing firing rate as a function of time for 5 of the 9 speeds tested. Bars at the top of each subpanel show the 500-ms duration of the stimulus. Flash separation was always set to the minimum achievable: Δt = 4 ms with Δx varying with stimulus speed. Responses to motion in the preferred and null directions are plotted upward and downward. The arrows at the right are drawn to give a scale of 50 spikes/s, and the same scale is used for the plots below. B: summary of the data in A: speed tuning on a logarithmic horizontal axis. Each point plots the mean response to the preferred direction as a function of speed. Error bars show the SE. The peak of the fit is at 17°/s, which is taken to be the preferred speed. C: responses to apparent motion at 16°/s at varying flash separations. The timing of the apparent motion flashes is indicated by the dots above each subpanel that fuse together to form a bar at smaller flash separations. D: summary of the data in C, plotted on a logarithmic horizontal axis. Each point plots the difference between the mean response in the preferred and null directions for a given flash separation. Error bars give the SE of this difference calculated from the SE of the 2 means. The half decline point of the fit is at 0.71°, and defines Δxmax. E: same as C but for a stimulus speed of 32°/s. F: summary of the data in E. The half decline point of the fit is at 1.02°. The eccentricity of this neuron was 10°. For each condition, 23-24 trials contributed to the data. The neuron (neuron 12) was recorded from the 2nd monkey (Macaca mulatta).

