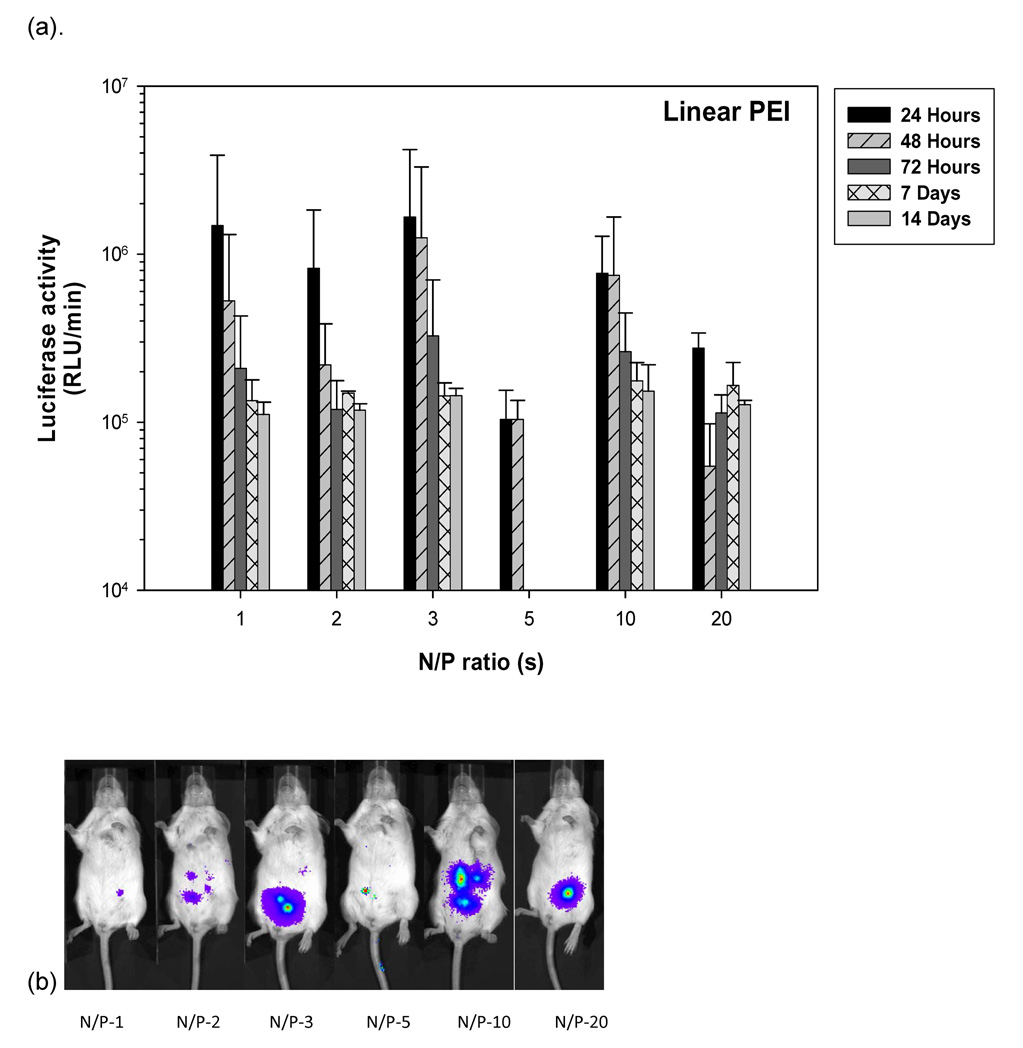
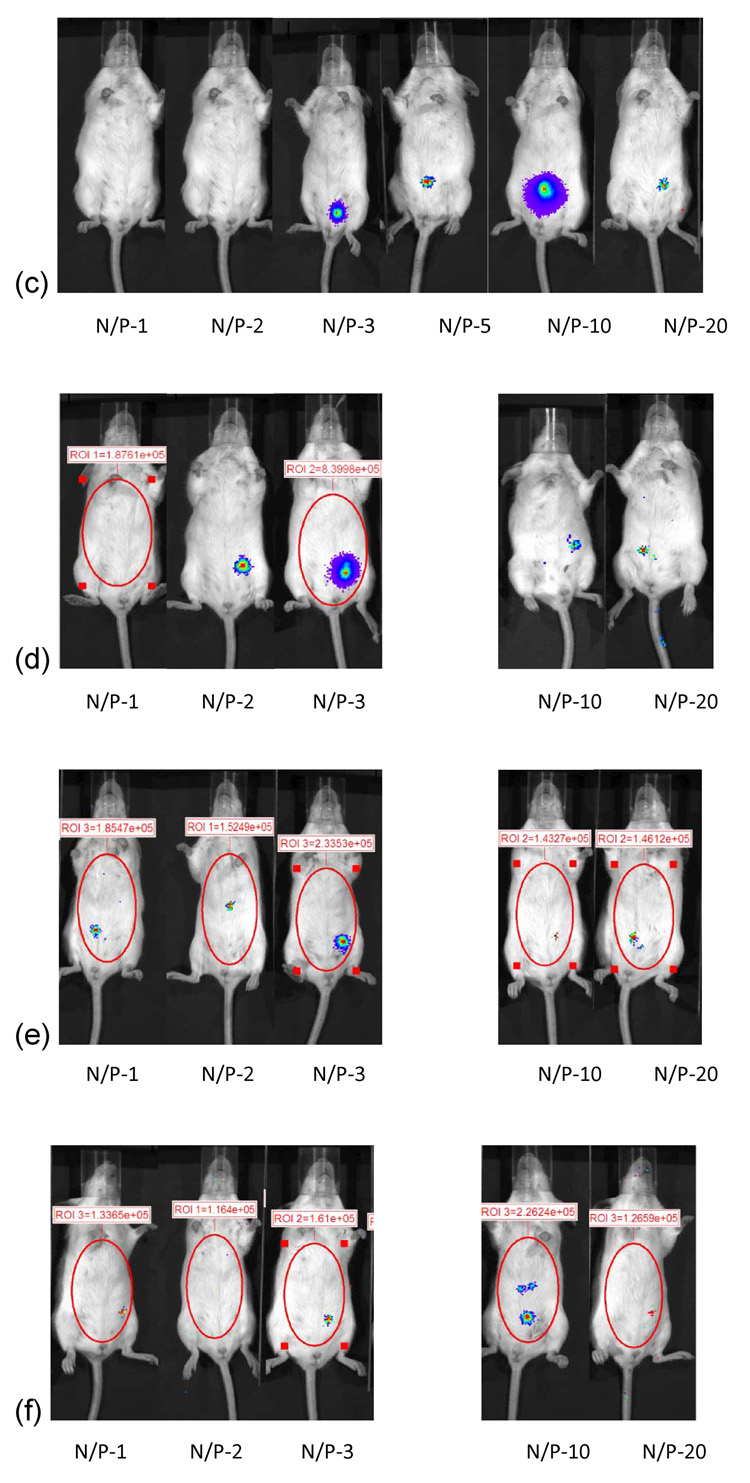
Figure 6.
Effect of linear PEI complexed with 25 micrograms of pDNA at different N/P ratios on gene expression in Balb/C. (a) Quantification of the signal produced in Balb/c mice after IP injection of each formulation. Values shown are mean ± standard deviation (n=3). (b)–(f) Luciferase expression in Balb/C mice measured by IVIS. (b), (c), (d), (e) and (f) represent 24 hours, 48 hours, 72 hours, 7 days and 14 days after injection. The number of photons is depicted in a color image superimposed on a video image of the animal. Each mouse presented in the figure is representative of at least three mice in each experiment.


