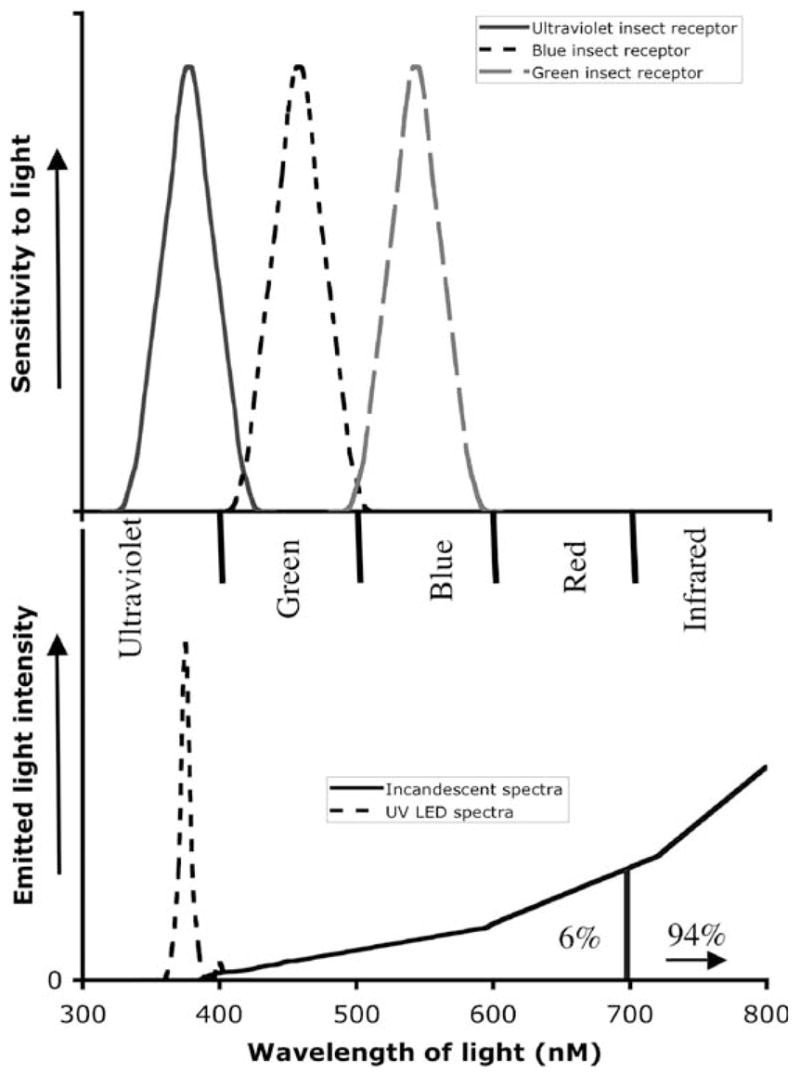
Fig. 1.

Insect vision and lighting spectra. The upper graph represents a schematic of the conserved insect photoreceptors and their maximum sensitivities in the ultraviolet, blue, and green spectra. The lower graph indicates the spectra emitted from ultraviolet light-emitting diode and incandescent lights. The overlap of the insect vision and the lighting system yields the light visible to insect eyes. Note that 94% of the incandescent bulb energy is expended in the infrared.
