
Figure 3.
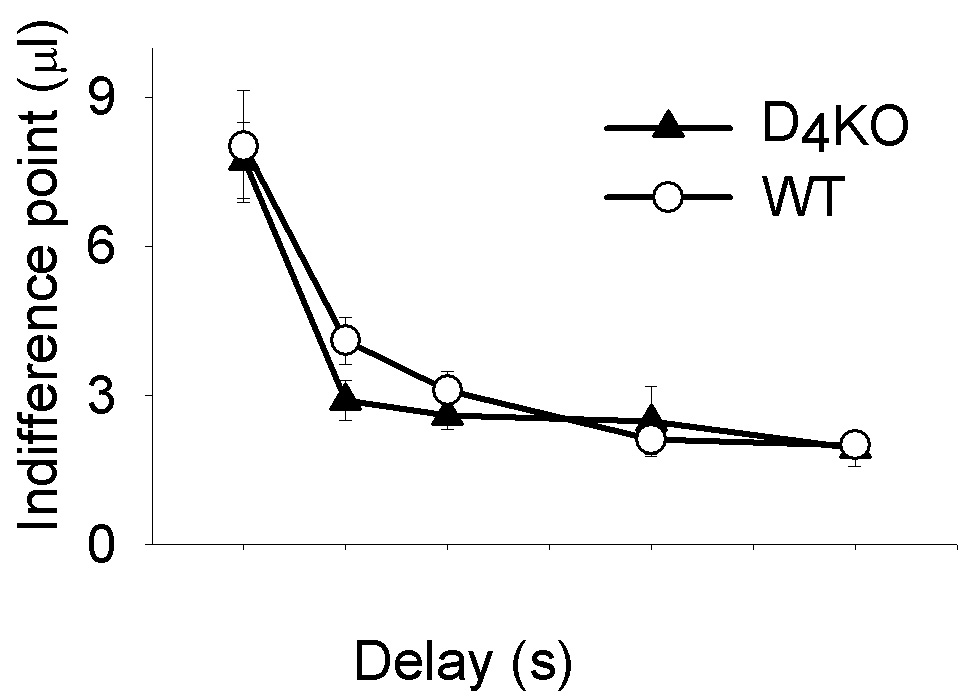
Mean (± SEM) of median adjusting sucrose amounts at indifference (µl) by delay (s) to 9.76 µl 10% sucrose for D4KO and WT mice from the last 40 of 80 choice trials for the final 5 sessions at each delay. Lower indifference points indicate greater impulsivity. There were no genotype differences in side bias (b; preference when Delay = 0 s) or in delay sensitivity (k; gradient of the discount function) as clearly shown in the figure (see text for statistical details).