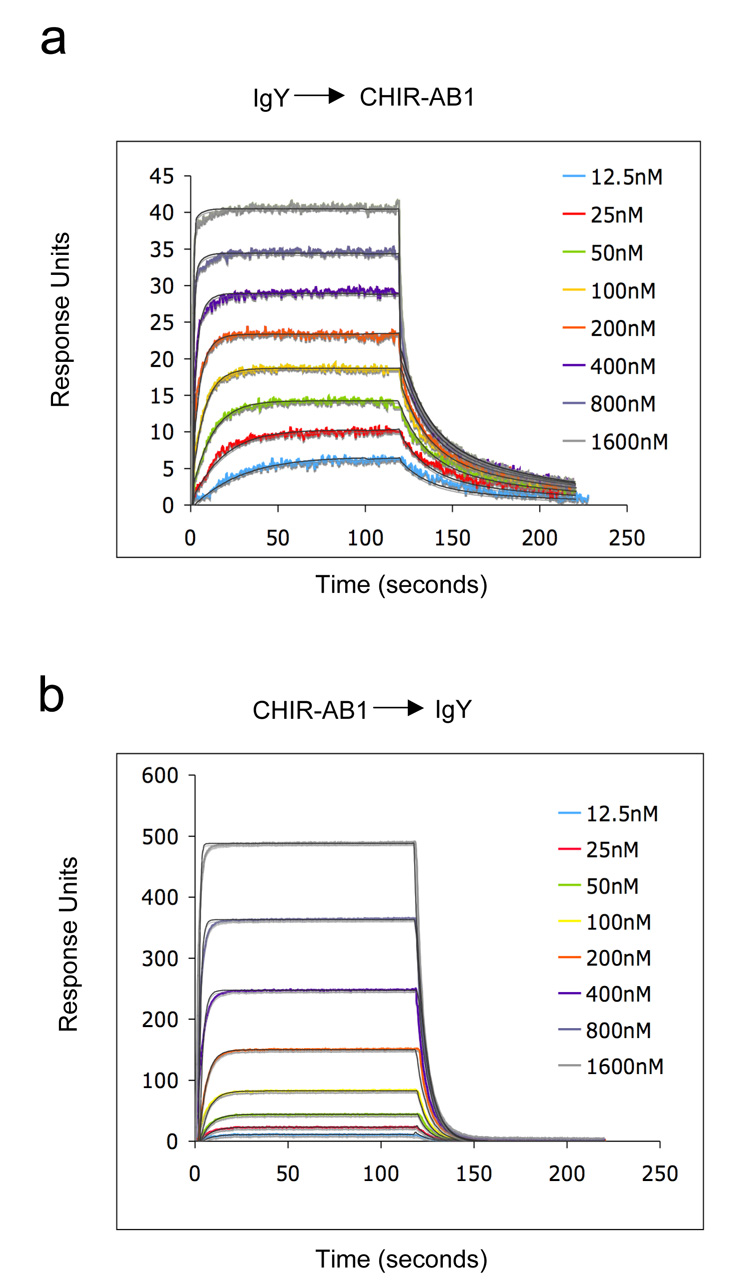
Figure 4. Biosensor analyses of CHIR-AB1/IgY interactions.
Representative sensorgrams describing the binding response of increasing concentrations of IgY injected over immobilized CHIR-AB1 (58RUs) (a) or CHIR-AB1 injected over immobilized IgY (2000RUs) (b). Colored lines show the observed response overlaid with the calculated response (black line) based on a 2:1 binding model. Fitting of the same data with a 1:1 binding model resulted with KD values of 17 ± 9nM (a) and 800nM (b). Similar results were obtained when CHIR-AB1 was coupled to the chip at different densities (140RU, 320RU and 560RU; data not shown).

