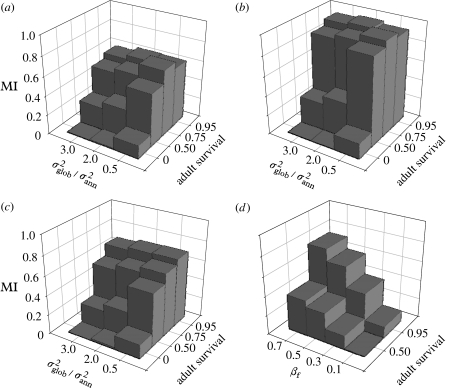
Figure 3.
MI as a function of environmental fluctuation, annual adult survival and female juvenile survival advantage. In (a), MI values are averages of population mean values from 10 separate simulations. In (b), MI values are averages of 10 replicate runs from two simulations each where mutation was turned off for 10 000 iterations. In (c), mutation was returned for another 10 000 iterations to all replicates in (b). In (a–c), βf=0.5 and βm=0. (d) MI when βf=0.1, 0.3, 0.5 or 0.7, βm=0, p=0.5 or 0.95 and =2 (after 10 000 iterations).

