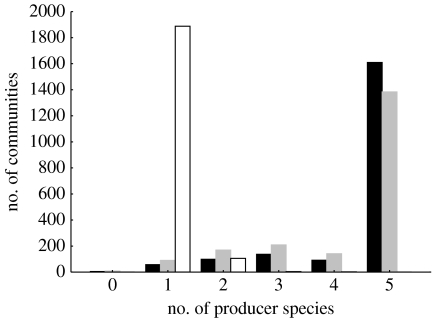
Figure 1.
Frequency distribution of the number of persistent producer species in simple producer communities (white bars) and complex food webs with random (black bars) or uniform (grey bars) preferences. Each of the three histograms is based on 2000 simulated communities that each initially contained five producer species.

