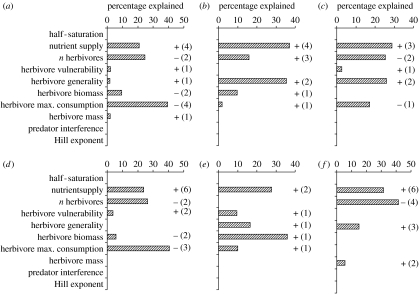
Figure 4.
CART analyses (see §2) identifying the main effects of various independent variables (see the y-axes) on (a,d) producer biomass, (b,e) the amount of herbivory and (c,f) the nutrient intake. Results are shown for models with (a–c) uniform or (d–f) random preferences. Bars indicate the proportional contribution of independent variables (see the y-axes) to the overall explained variance. Additional information is given by the signs of the effects and the number of splits that an independent variable contributed. Note that the signs of the effects were unambiguous for independent variables affecting multiple splits.

