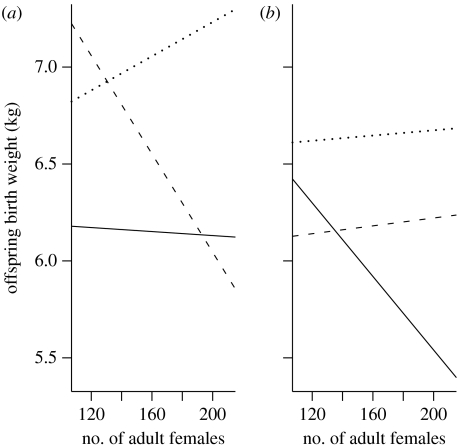
Figure 1.
Plots showing the interaction between density and lifetime contribution to population growth, Σpt(i), in explaining offspring birth mass for (a) male offspring (interaction significant, see table 1a) and (b) female offspring (interaction not significant, see table 1b). See text for definitions of high, medium and low quality. Solid line, low total pt(i); dashed line, medium total pt(i); dotted line, high total pt(i).

