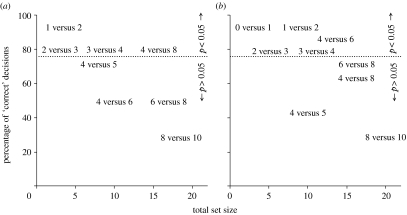
Figure 2.
Results from two field experiments where birds were allowed to choose between two cache sites containing different numbers of prey. The percentage of birds that chose the cache site containing the greater number of prey is shown on the y-axis. The total number of prey used in each treatment is shown on the x-axis. Treatments are labelled by the number of prey hidden in each of the two compartments. Treatments located above the dotted line (11 or more ‘correct’ decisions) had a greater number of correct decisions than expected by chance based on the binomial distribution (i.e. p<0.05). (a) Results from experiment 1, where only mealworms were presented to birds (uncontrolled). (b) Results from experiment 2, where small rocks were placed in wells containing fewer mealworms to control for time and volume confounds.

