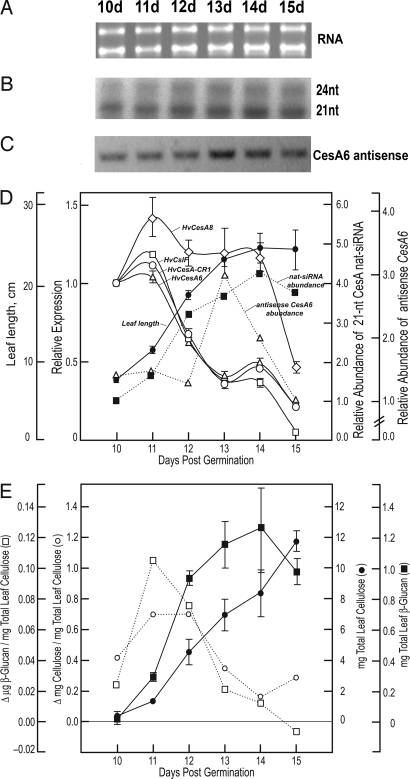
Fig. 2.
CesA antisense small RNAs correlate negatively with primary cell wall CesA gene expression and rates of cellulose and β-glucan biosynthesis. (A) RNA quantity and quality was verified by agarose gel electrophoresis. (B) Ribonuclease protection assays were performed by using the short HvCesA6 sense probe. (C) Strand-specific RT-PCR was performed with A6-sense-(m) and A6-antisense-1 primers on cDNA synthesized from the time-course RNA by using sense primer A6-sense-(m). Digital photograph of the ethidium bromide-stained gel is shown in inverted contrast for clarity. (D) Comparative quantitative real-time PCR of developing barley third leaves was performed to determine the expression relative to day 10 of several putative primary cell wall CesA genes (HvCesA1 and HvCesA6), a putative secondary cell wall CesA gene (HvCesA8), and the HvCslH1 and HvCslF6 genes. Overlaid are the average leaf blade lengths (cm) ± SD. Ubiquitin10 expression was used as the normalizing target and BSMV/V-PDS (BSMV/PDS4as) as the calibrator (35). Values are the average ± SD of 3–5 biological replicates and are relative to plants infected with empty vector-PDS control plants. Error bars not shown are within the limits of the symbol. Amounts of the 21-nt small RNA, with expression relative to day 10, were quantified by densitometry. (E) Total accumulation and relative rates of cellulose biosynthesis are expressed as the average wt. recovery (mg) ± SD. Values for amounts and relative rates of β-glucan synthesis are mean of 2 replicates.

