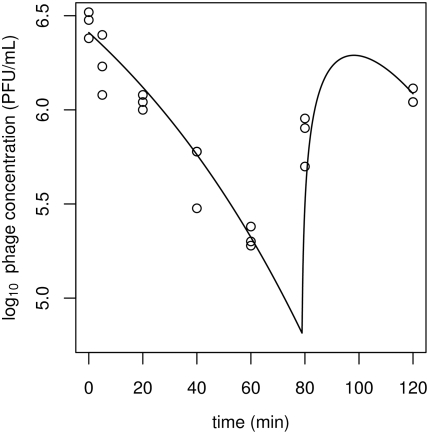
Figure 2. Binding of phages to bacterial hosts and the subsequent release of phage at lysis of infected cells.
The plot shows data from one of the three cultures in the binding assay, with observed concentrations of free phages in log10 PFU mL−1 (points) and the fitted curve V(t) (line), derived from Equation 1. Lysis of infected hosts is well synchronised at approximately 1.3 hours, although this is exaggerated by the fitted curve. The phage concentration does not appear to increase, which is consistent with the low estimate for the burst size (approximately equal to 2 virions).

