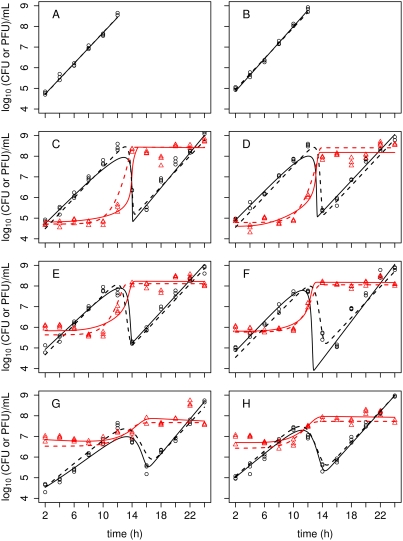
Figure 3. Data from interaction experiments together with fitted curves obtained by maximum likelihood estimation.
Concentrations of C. jejuni (circles; black) and phage (triangles; red) vary together in a way consistent with the threshold theory of phage-bacterial interactions. Fitted models in which parameters are either common to all (dashed) or allowed to vary between cultures (solid). Panels (A–H) correspond to cultures 1–8, respectively, with fitted parameters as given in Table 2 and Table 3.

