Fig. 5.
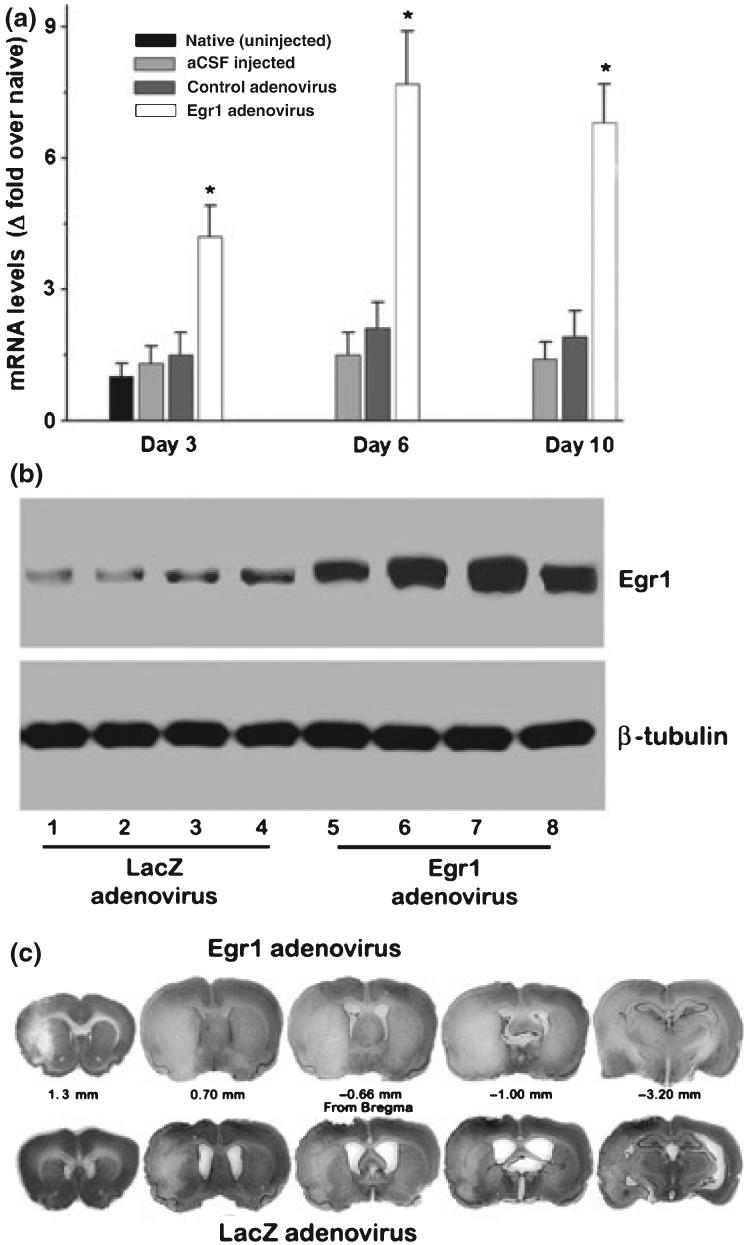
In adult rats, Egr1 adenovirus administration significantly induced Egr1 mRNA expression (a) and protein expression (b) in the cortex. Representative Cresyl violet-stained sections from a rat in the Egr1 adenovirus group show exacerbated ischemic infarct size compared to a rat in the control adenovirus group (c). The values in the histogram are mean ± SD of n = 4/group. *p < 0.05 compared to the control adenovirus group by ANOVA followed by Tukey-Kramer multiple comparisons post-test.

