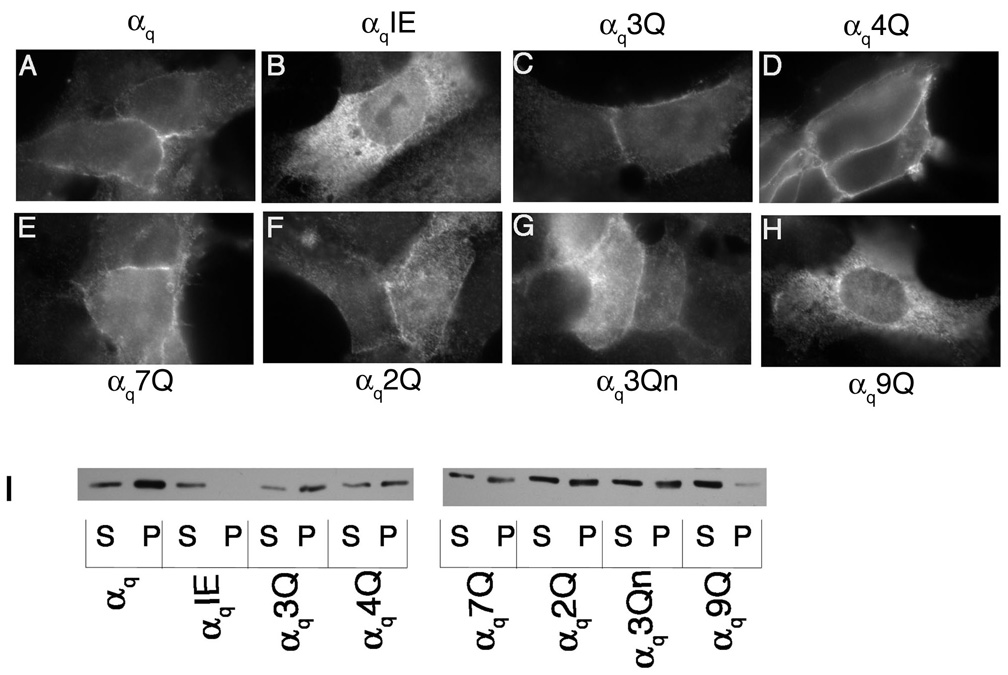
Figure 3. Localization of αq glutamine mutants.
HEK293 cells were transfected in 6-well plates containing coverslips with 0.4 µg pcDNA3 along with 0.6 µg αqpcDNA3 (A), αqIEpcDNA3 (B), αq3QpcDNA3 (C), αq4QpcDNA3 (D), αq7QpcDNA3 (E), αq2QpcDNA3 (F), αq3QnpcDNA3 (G), or αq9QpcDNA3 (H). 40 hours after transfection cells were fixed with 3.7% formaldehyde and visualized as described under “Experimental Procedures.” I, HEK293 cells were transfected in 6-cm plates with 1.2 µg pcDNA3 along with 1.8 µg pcDNA3 containing the indicated α subunit. Approximately 40 hours after transfection cells were lysed in hypotonic lysis buffer and soluble and particulate cell fractions were separated as described under “Experimental Procedures.” 2.5% of each fraction was resolved on 12% SDS-PAGE and the α subunits were visualized by immunoblotting with the 12CA5 antibody.

