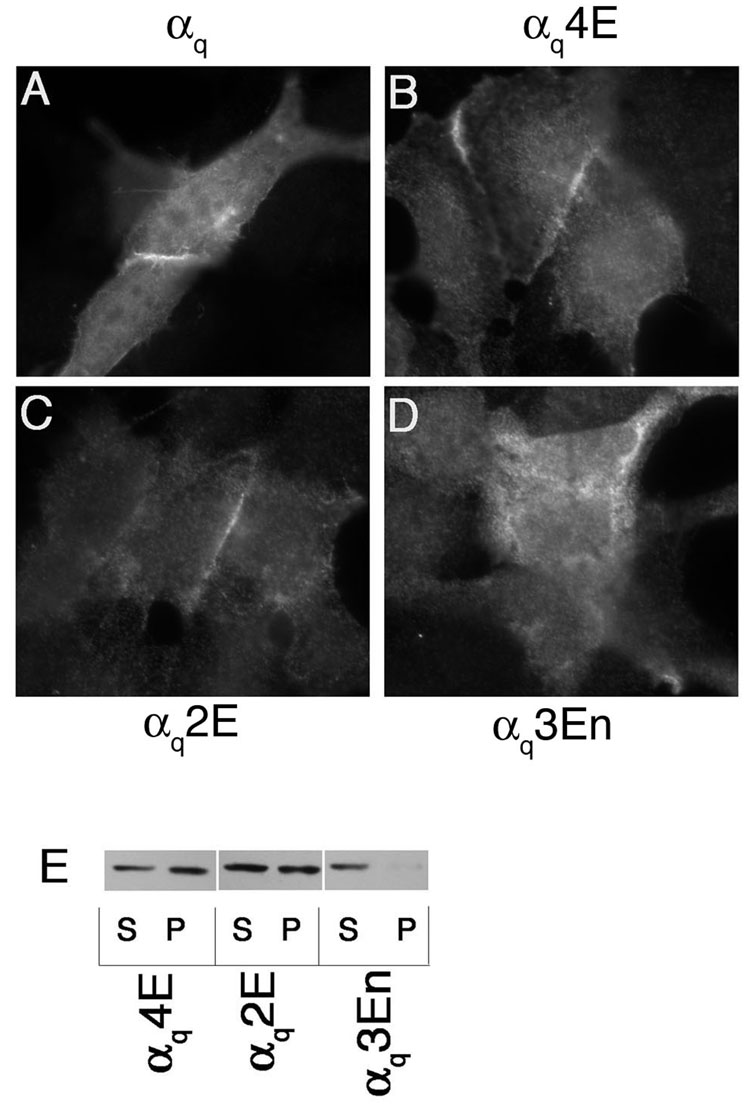
Figure 4. Localization of αq glutamic acid mutants.
HEK293 cells were transfected in 6-well plates containing coverslips with 0.4 µg pcDNA3 along with 0.6 µg αqpcDNA3 (A), αq4EpcDNA3 (B), αq2EpcDNA3 (C), or αq3EnpcDNA3 (D). 40 hours after transfection cells were fixed with 3.7% formaldehyde and visualized as described under “Experimental Procedures.” E, HEK293 cells were transfected in 6-cm plates with 0.6 µg pcDNA3 along with 2.4 µg pcDNA3 containing a glutamic acid mutant. Approximately 40 hours after transfection cells were lysed in hypotonic lysis buffer and soluble and particulate cell fractions were separated as described under “Experimental Procedures.” 2.5% of each fraction was resolved on 12% SDS-PAGE and the α subunits were visualized by immunoblotting with the 12CA5 antibody.

