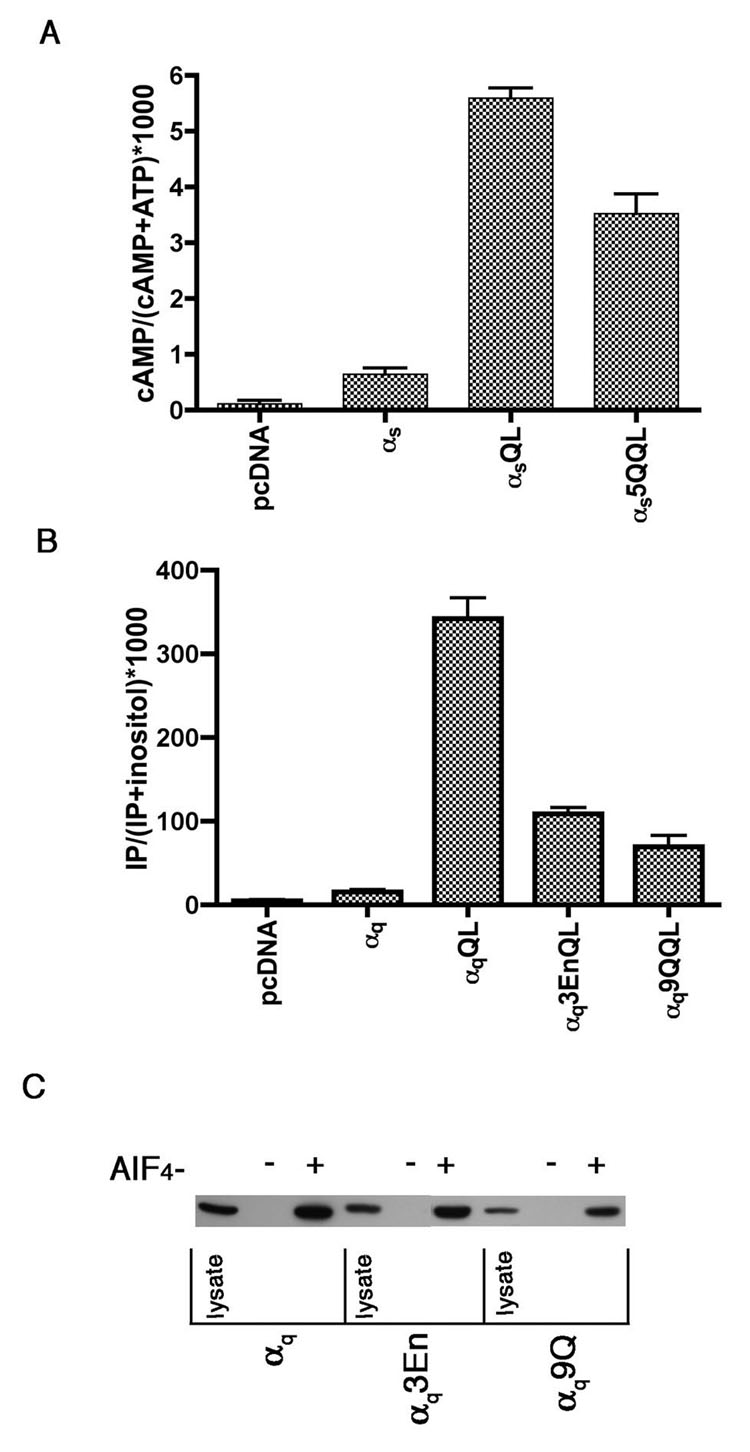
Figure 9. Signaling by αs and αq polybasic mutants.
A, HEK293 cells were transfected in 6-well plates with either 1 µg pcDNA3, 1 µg αspcDNA3 or 0.8 µg pcDNA3 plus 0.2 µg pcDNA3 containing the indicated mutant αs. 24 hours after transfection cells were labeled with [3H] adenine. 16 hours later cAMP accumulation was measured as described under “Experimental Procedures.” B, HEK293 cells were transfected in 6-well plates with either 1 µg pcDNA3 or 0.7 µg pcDNA3 plus 0.3 µg pcDNA3 containing the indicated αq construct. 24 hours after transfection cells were labeled with [3H] inositol. 16 hours later inositol phosphate was assayed as described under “Experimental Procedures.” C, HEK293 cells were transfected in 6-cm plates with the indicated αq construct. 24 hours after transfection cells were lysed and incubated in the presence or absence of AlF4 − for 2 hours at 4°C with GST-RGS4, purified as described under “Experimental Procedures.” Beads were then washed 3 times with lysis buffer. Protein was eluted from the beads by boiling in sample buffer for 5 minutes. 3.3% of the lysate and 40% of the pull downs were resolved by SDS-PAGE and visualized by immunoblotting with the 12CA5 antibody.

