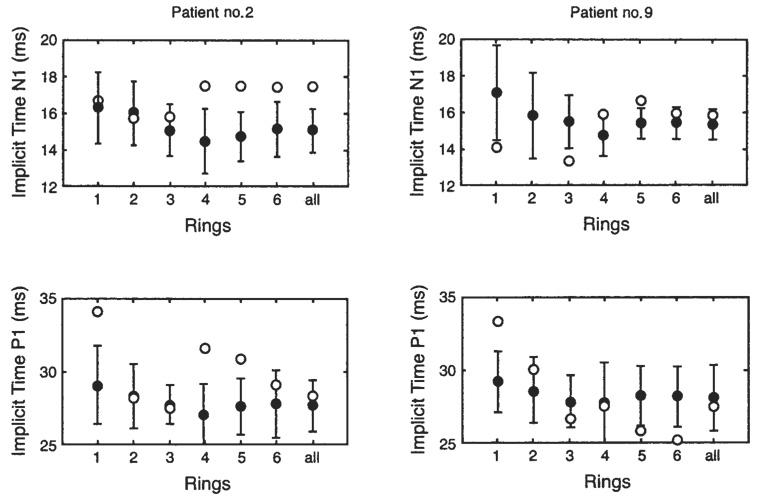
FIGURE 6.
Delay in N1 (first negative trough) and P1 (first positive peak) implicit times for 2 cystic fibrosis patients (E) and for the respective age-matched control subjects (●; n = 10). The error bars for the control subjects represent ± 2 SDs. The 6 concentric rings are numbered from the center (ring 1) to the periphery (ring 6) as illustrated in Figure 1.

