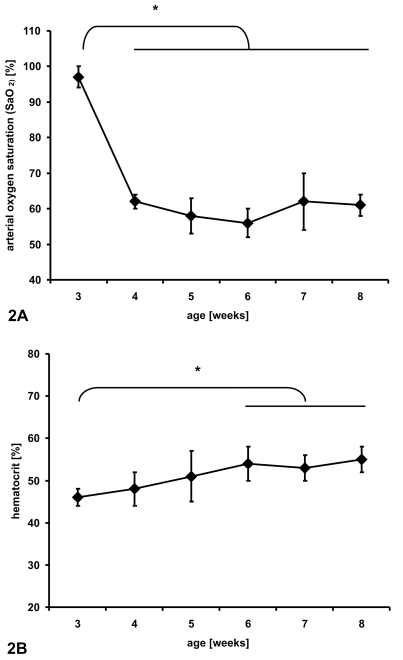
Figure 2. Cumulative data of blood gas analyses of sham-operated animals that have been exposed to chronic hypoxia.
The shown data demonstrate immediate changes of arterial oxygen saturation upon exposure to hypoxia (FiO2 = 0.12) (2a) followed by increased hematocrit (2b). The banded animals responded to hypoxia in the same manner when compared to non-banded animals (not shown) (*p<0.01).

