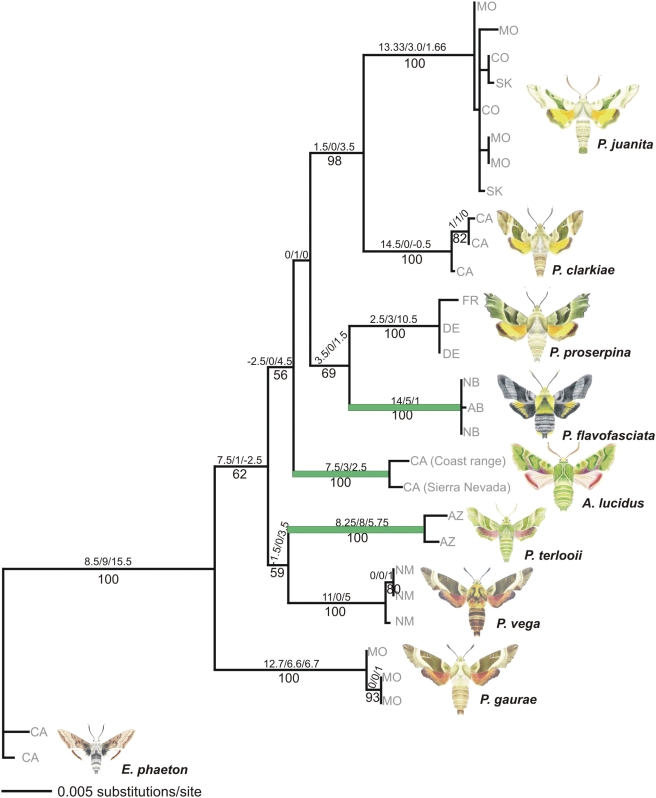
Figure 3. ML phylogram (−ln likelihood = 899.956) generated from the combined COI, EF1α, and wingless dataset using the GTR+I+G model of evolution.
Branch support is given beneath branches as bootstrap values (1000 replicates). Numbers above branches indicate decay indices (MP) determined separately for COI, wingless and EF1 α, respectively. Accession location data are mapped onto the tree (MO, Missouri; CO, Colorado; CAN, AB, Alberta [Canada]; NB, New Brunswick [Canada]; SK, Saskatchewan [Canada]; FR, France; DE, Germany; CA, California; AZ, Arizona; NM, New Mexico). Saltational taxa are highlighted in green.

