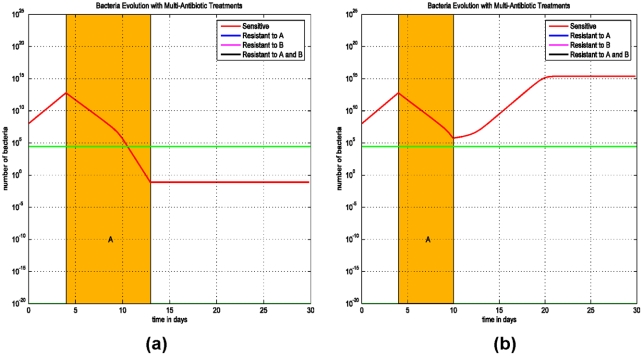
Figure 1. Simulations of Model (1) on the duration of antimicrobial treatment and its effects on infection progression.
The initial value is chosen between 106 and 1015, so the solution increases initially. The green line represents the threshold of bacterial load above which an infection develops. Below this threshold, the phagocyte density is sufficient to prevent the progression to infection. (a) Treatment starts at the 4th day after an infection and lasts for 9 days. The bacterial load decreases to below the threshold and the infection is prevented. (b) Treatment starts at the 4th day after an infection and lasts for only 6 days. The bacterial load decreases to close to the threshold, but stays above it and increases again. The infection becomes more progressive.

