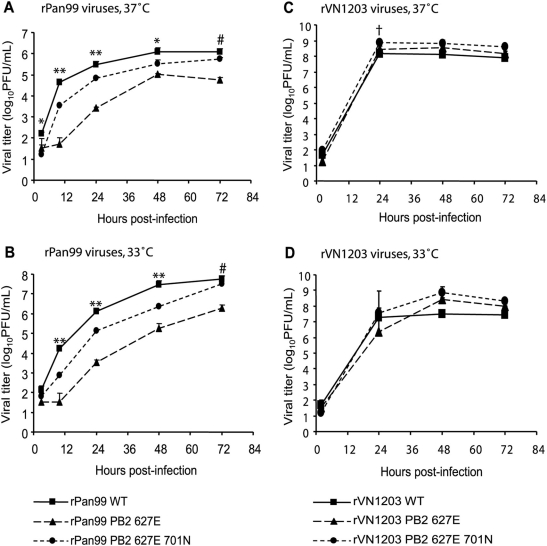
Figure 2. Growth kinetics of wild-type, PB2 627E and PB2 627E 701N viruses in MDCK cells incubated at 37°C and 33°C.
(A) and (B) show the results from rPan99-based viruses, while (C) and (D) show the results from rVN1203-based viruses. Titers of the wild-type viruses are shown with squares and solid lines; titers of PB2 627E mutants are shown with triangles and long dashed lines; and titers of PB2 627E 701N viruses are shown with circles and short dashed lines. The MOI of infection in all cases was 0.01 PFU/cell. ** all three viruses are significantly different from each other (p<0.05, Student's t-test). * the titers of both mutants are significantly different from those of the wild-type (p<0.05, Student's t-test). # the titers of the 627E mutant are significantly different from those of both the wild-type and the 627E 701N viruses. † the titers of the 627E 701N double mutant are significantly different from those of both the wild-type and the 627E single mutant viruses.

