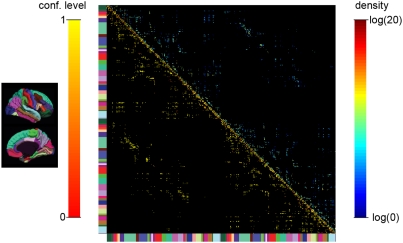
Figure 5. High-resolution structural connection matrix.
High-resolution structural connection matrix, representing the fiber density (upper triangular part) and the confidence level (lower triangular part). The matrix is organized as follows: the upper left block represents the connections in the right hemisphere and the lower right block shows the connections in the left hemisphere. The off-diagonal blocks map the inter-hemispheric connections. The color bar at the left and bottom of the matrix help to make the correspondence between the matrix entries and the cortical parcels as displayed on the left part of the figure.

