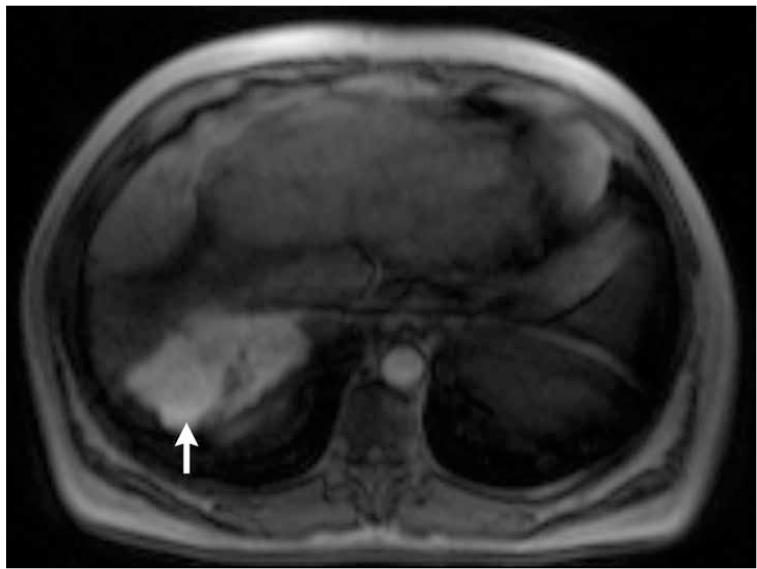
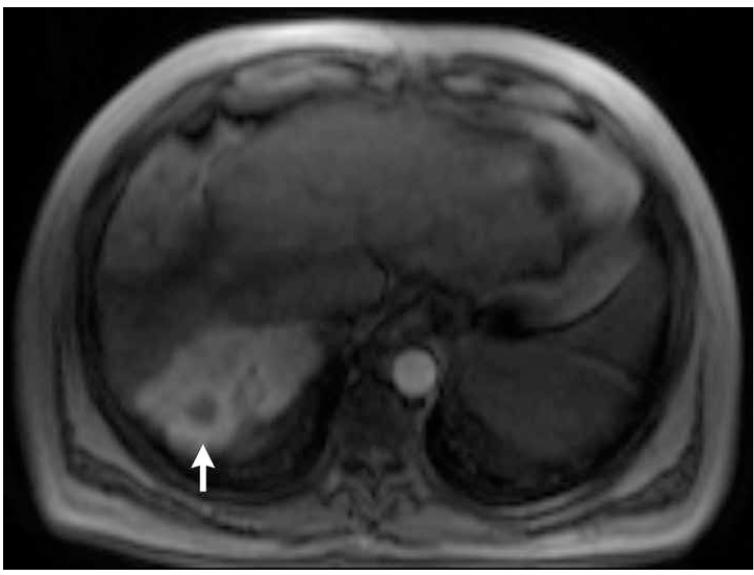
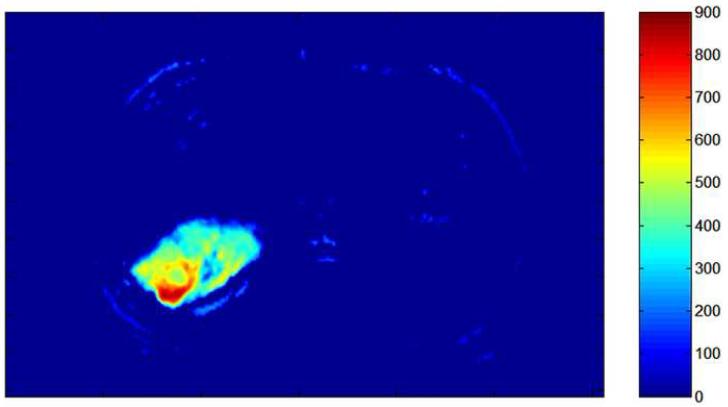
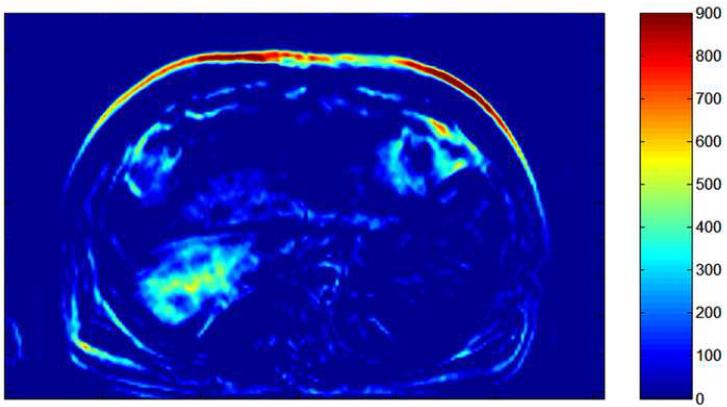
Figure 4.
Pre- (a) and post-TACE (b) 4D TRIP-MRI and corresponding AUC tumor perfusion maps (c) and (d) in different patient show significant reduction in segment 7 HCC (arrow) perfusion (AUC reduction from 505 to 242). Tumor perfusion is expressed in arbitrary units on colored scale, with 900 indicating maximum perfusion.


