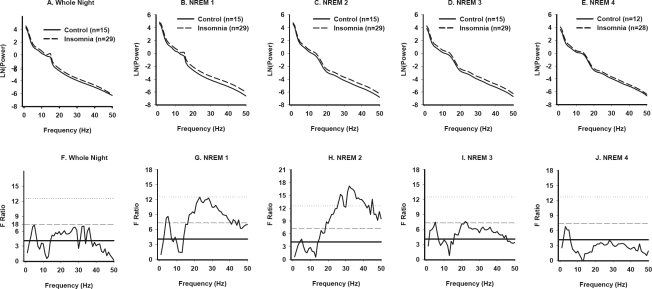
Figure 2.
Power spectral analysis of NREM sleep in Primary Insomnia and Good Sleeper Control subjects (Women). NREM EEG power across frequencies from 0.5–50 Hz for the whole night (A), and for individual NREM periods (B-E) in PI and GSC women. F tests conducted at each 1-Hz frequency bin are displayed for all-night NREM data (F) and for each successive NREM period (G-J). See Figure 1 legend for details.

