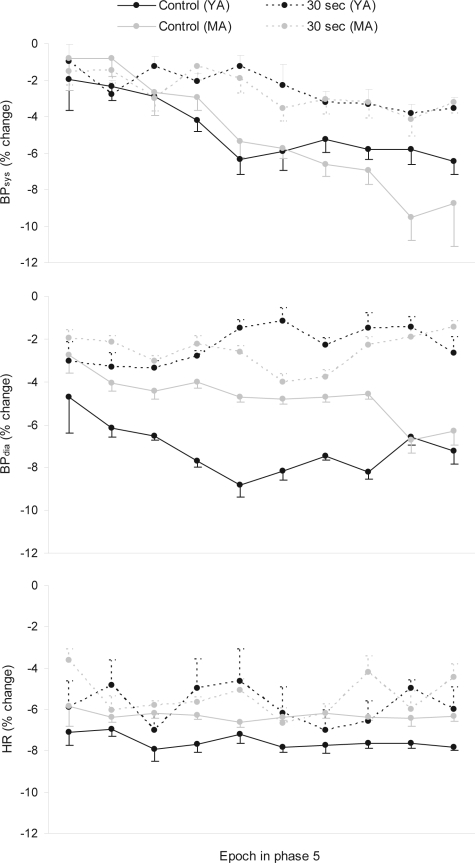
Figure 6.
% change from nightly mean values in BPsys, BPdia, and HR in MA and YA during the control and 30-sec experimental condition during phase 5
Legend: BPsys, systolic blood pressure; BPdia, diastolic blood pressure; HR, heart rate. N=10 per age group. Standard error bars indicate within-subject variability (variance in the change within subjects over time).

