

Abstract
Study Objectives:
Respiratory cycle-related EEG changes (RCREC) have been demonstrated during sleep by digital analysis and hypothesized to represent subtle inspiratory microarousals that may help to explain daytime sleepiness in patients with sleep-disordered breathing. We therefore examined for the first time associations between RCREC and esophageal pressure swings (ΔPes) that reflect work of breathing.
Design:
Retrospective analysis
Setting:
Academic sleep laboratory
Patients:
Forty adults referred for suspected sleep disordered breathing
Interventions:
Polysomnography with esophageal pressure monitoring and automatic computation of ΔPes using a novel algorithm.
Results:
Computed ΔPes for nearly all respiratory cycles during sleep correlated well with visual scoring of selected respiratory cycle samples (Spearman rho = 0.86, P < 0.0001). The RCREC within the sigma EEG range (12.5–15.5 Hz) rather than that within other frequency ranges most often showed significant within-subject inverse correlations with ΔPes. In contrast, in between-subject comparisons, beta (15.5–30.5 Hz) and to a lesser extent theta (4.5–7.5 Hz) RCREC, rather than sigma RCREC, showed significant inverse associations with mean ΔPes.
Conclusions:
Variation within subjects of sigma RCREC with ΔPes supports previous evidence that RCREC within this range may reflect microarousals exacerbated by increased work of breathing. Correlation of beta and theta, but not sigma RCREC with ΔPes in between-subject comparisons is more difficult to explain but suggests that ranges other than sigma also deserve further investigation for clinical utility.
Citation:
Chervin RD; Malhotra RK; Burns JW. Respiratory cycle-related EEG changes during sleep reflect esophageal pressures. SLEEP 2008;31(12):1713–1720.
Keywords: Polysomnography, sleep apnea, obstructive, signal processing, computer-assisted, respiratory cycle-related EEG changes, respiration, esophageal pressure, electroencephalography
ONE OF THE CARDINAL SYMPTOMS OF SLEEP DISORDERED BREATHING (SDB) IS EXCESSIVE DAYTIME SLEEPINESS, BUT STANDARD POLYSOMNOGRAPHIC variables most often used to diagnose and quantify SDB do not predict levels of sleepiness well.1–4 Most such variables and other experimental approaches thus far investigated focus on discrete apneas, hypopneas, or respiratory-event related arousals. These derive from a conception of obstructive sleep apnea as a problem of recurrent 10-second or longer obstructive events triggered by repetitive narrowing of upper airway caliber and recovery with arousal. Nonetheless, clinicians who use esophageal pressure monitoring5 have long realized that SDB patients also breathe abnormally during large portions of the night not occupied by discrete apneic events. Specifically, SDB patients show excessively negative esophageal pressure swings, consistent with excessive work of breathing through much of the night even when apneas, hypopneas, and respiratory-event related arousals do not occur.6
To examine whether excessive work of breathing in non-apneic sleep might cause numerous inspiratory microarousals on a breath-to-breath basis and thereby contribute to excessive daytime sleepiness, we developed a computer algorithm to quantify subtle EEG changes that could occur in synchrony with the non-apneic respiratory cycle.7 We named these changes respiratory cycle-related EEG changes, or RCREC. Among 10 children, most of whom were scheduled for adenotonsillectomy for clinical diagnoses of SDB, RCREC seemed more prominent in those with obstructive sleep apnea than among those who did not have evidence of sleep apnea on polysomnography.8 The RCREC predicted sleepiness as measured by the multiple sleep latency test, whereas the apnea/ hypopnea index did not. Changes in RCREC predicted changes in sleepiness, at one-year follow-up assessments, whereas again changes in the apnea/ hypopnea index did not. In a sample of 38 adults studied for suspected SDB, RCREC predicted multiple sleep latency test-defined sleepiness better than did any other standard polysomnographic measure.9 The RCREC within the sigma (12.5– 15.5 Hz) EEG frequency range proved most useful in this regard. Among 103 children scheduled for adenotonsillectomy or unrelated surgical care (n = 77 and n = 26, respectively), sigma RCREC in comparison to the apnea/ hypopnea index predicted subjective sleepiness just as well, and independently.10
These findings were consistent with the original hypothesis that RCREC reflect inspiratory microarousals. Furthermore, among the 38 adults, inspiration was associated on average with a decrease in EEG delta power and an increase in sigma power, to an extent that was more obvious among excessively sleepy subjects than among those who were less sleepy.9 As might be expected of a new variable with hoped-for predictive value substantially different from that of standard measures, RCREC generally do not correlate strongly with the apnea/hypopnea index or measures of oxygen desaturations.8,9 However, none of these observations prove that RCREC do, in fact, represent inspiratory microarousals, even if the search for such events did originally prompt detection and description of RCREC.
To help clarify the relationship between RCREC and work of breathing, we have now computed RCREC for a new sample of 40 adult subjects studied for suspected SDB with esophageal pressure monitoring during otherwise standard polysomnography. Our hypothesis was that RCREC, especially in sigma frequencies that proved most closely predictive of sleepiness in prior studies, would correlate to some extent with the magnitude of esophageal pressure swings. We did not expect a high level of correlation—esophageal pressures themselves do not necessarily predict sleepiness perfectly11—but some level of correlation would help to confirm a relationship between RCREC and work of breathing.
METHODS
Subjects
Sleep laboratory-referred subjects whose data were selected for this retrospective analysis met the following criteria: (1) age ≥ 18 years, (2) full-night diagnostic polysomnography performed at the University of Michigan Sleep Disorders Center between October 2005 and March 2006, (3) purpose of the study was mainly to assess for suspected SDB, (4) esophageal monitoring had been requested by the referring clinician and was used successfully without technical complications, (5) ≥ 4 hours of sleep were recorded. This study was approved by the University of Michigan Medical Institutional Review Board.
Polysomnography
Polysomnography included electroencephalography (C3-A2, C4-A1, O1-A2, O2-A1 of the International Electrode Placement System), chin surface electromyography, bilateral electrooculography, electrocardiography, bilateral leg surface electromyography, oronasal airflow (thermocouples), nasal pressure, chest and abdominal excursion (piezo electric bands), finger pulse oximetry, and esophageal pressure monitoring using an esophageal balloon (Compumedics Limited, Melbourne, Australia). Previous data from this laboratory12 and others13 have indicated that esophageal pressure monitoring has negligible effects on recorded sleep. Scoring of polysomnograms followed standard existing guidelines,14 and reliability procedures previously described for our laboratory.3 An obstructive apnea was defined as ≥ 10-s absence of thermocouple-defined airflow during sustained effort in chest or abdominal leads. An hypopnea was defined as ≥ 10-s, ≥ 30% decrement in thermocouple-defined airflow followed by arousal, awakening, or ≥ 4% oxygen desaturation. The apnea/ hypopnea index was defined as the number of apneas or hypopneas per hour of sleep.
Esophageal Pressure
Clinical and published use of esophageal pressure data generally has relied on quantification of results for respiratory cycles selected by human eye.15–17 This has limited analyses to identification of (1) crescendo increases of specified or unspecified magnitude leading to arousals; (2) maximum (most negative) esophageal pressure recorded in the study; (3) means of values sampled intermittently by technologists (our laboratory clinical practice); or (4) percent of epochs with esophageal pressure swings more negative than −10 cm of water.10 For the current analyses, quantitative data from nearly every respiratory cycle was desired but clearly could not be obtained by human scoring. We therefore developed and validated a new automated method to quantify esophageal pressure results.
Polysomnograms were exported from Compumedics software into European Data Format (EDF). To compute the magnitude of the esophageal pressure swing for each respiratory cycle (ΔPes), the esophageal pressure channel was low pass filtered to remove artifacts, and local excursions of the signal were then computed. Specifically, the esophageal pressure signal was first detrended to remove the mean and any linear trend every 10 seconds. The signal was then lowpass filtered using a 5th order Butterworth digital filter with a 0.5-Hz frequency cutoff. Adjacent local maximums and minimums were identified using the zero crossings of the signal. The esophageal pressure swing for each respiratory cycle (ΔPes) was then calculated as the difference between the local minimum following a local maximum. The resulting value was negative.
As discussed below, the time evolution of the ΔPes times series was examined on a breath-to-breath basis, averaged over 30-s epochs, and over the entire night. The ΔPes times series averaged over 30 s of staged sleep or wakefulness was considered to evaluate the time evolution of ΔPes within a given epoch, and averages over the entire night were considered to compute a single number characterizing a given subject. Specifically, the mean ΔPes value for a particular subject over all sleep epochs was computed as the mean of the ΔPes values over all non-wake respiration cycles. To screen out respiration signal artifacts, only respiration cycles with amplitudes and durations between the 5th and 95th percentile were used in the calculations when averages were computed over time intervals >30 seconds.
To assess the validity of the automated quantification of esophageal pressure against human scoring, we compared the mean ΔPes values for each subject computed over all sleep epochs to that obtained by human visual scoring. The latter followed our clinical laboratory protocol that requires samples ≥ 10 representative respiratory cycles during NREM sleep, REM sleep, and wakefulness for a total of ≥ 30 samples across the night. Figure 1 shows that for the 40 subjects whose data are reported in this study, the mean ΔPes that was automatically computed correlated well with the mean ΔPes derived by human eye via our usual laboratory protocol (Spearman rho = 0.86, P < 0.0001). Figure 2 shows a Bland and Altman plot of the automatically computed variable in relation to the results of human scoring: reasonable accuracy with only a small bias is shown for the new automated measure.
Figure 1.

The mean magnitude of esophageal pressure swings (expressed in cm of water pressure) recorded during sleep, as calculated by a computer, is plotted against results of sampling by human eye (Spearman rho = 0.86, P < 0.0001).
Figure 2.

A Bland and Altman plot shows that esophageal pressure changes with each respiratory cycle, as computed automatically by a newly developed algorithm, provided a reasonably accurate measure as compared to human scoring of representative respiratory cycles. Bias was small, with the human measure proving only about 4 cm of water pressure more negative than the automated measure on average.
Respiratory Cycle-Related EEG Changes (RCREC)
The RCREC were computed in large part as previously described, using an algorithm written in MatLab (Mathworks, Natick, MA).9 Briefly, the C3-A2 EEG channel was band pass digitally filtered to form five times series corresponding to the delta (0.5–4.5 Hz), theta (4.5–7.5 Hz), alpha (7.5–2.5 Hz), sigma (12.5–15.5 Hz), or beta frequencies (15.5–30.5 Hz). The filtering was performed by applying a 5th order Butterworth digital filter (with cutoff frequencies indicated parenthetically above) to the C3-A2 EEG data. The filter was implemented using a zero-phase forward and reverse filtering technique (using the MatLab filtfilt function) that has zero phase distortion. Four temporal regions of each respiratory cycle—early expiration, late expiration, early inspiration, late inspiration—were identified using the maximums and minimums of the filtered Pes signal described above. For each respiratory cycle and specific frequency band, the mean EEG intensity over each region was calculated and divided by the mean intensity over the respiration cycle. Thus we computed the frequency-specific, normalized average power over each temporal region for each respiration cycle. The calculation of RCREC is illustrated in Figure 3.
Figure 3.

The respiratory cycle-related EEG change (RCREC) calculation and associated data are shown for a single respiration cycle. The calculation measures the variation of the EEG signal power for a specific frequency band within a single respiratory cycle. The process begins by applying a digital lowpass filter to the measured esophageal pressure (A) to produce a respiration signal with reduced artifacts (B). The minimums and maximums of this signal are used to derive the ΔPes and to define 4 time segments corresponding to different intervals of the respiration cycle. A digital bandpass filter is applied to the measured EEG signal (C) to produce a time series corresponding to a specific frequency band. This signal is squared to produce a time series giving the variation of EEG power with time in the frequency band (D). The mean EEG power in the frequency band (from D) is then computed for each of the four respiration cycle time segments defined by the filtered respiration cycle (B). The mean power for each interval is then normalized by the mean frequency-specific power over the entire respiration cycle. One is subtracted from each result to get the measures shown for the 4 intervals in (E). The RCREC is then computed here as the difference between the maximum and minimum values. In practice, segment-specific EEG powers would be averaged over many respiratory cycles before the difference shown in (E) is computed.
To generate the RCREC metric for a given time period, the mean value of the normalized mean EEG power for each of the 4 respiratory cycle regions was computed over all respiratory cycles. The RCREC was computed as the difference between the region means. As with the ΔPes calculation, only respiration cycles as defined by Pes with airflow amplitudes and durations between the 5th and 95th percentile were used in the calculation, to screen for artifacts when RCREC was computed over time intervals >30 s. The RCREC computed within 30-s epochs of staged sleep or wakefulness were considered to evaluate the time evolution of RCREC within a given subject, and averages over longer time periods were considered to compute a single number that characterizes a given subject.
Analysis
Statisitical analysis was performed using the MatLab Statistical Toolbox Version 5.2 (Mathworks, Natick, MA). The non-parametric Spearman correlation coefficient rho was used to compare 30-s averaged ΔPes with RCREC, within subjects, and to compare RCREC with standard PSG measures and sleepiness between subjects. The level of significance was set at P < 0.05.
RESULTS
Subjects
The 40 subjects had a mean age of 43 ± 11 (SD) years (range 21 to 74), and the sample included 14 men and 26 women. Standard sleep measures for the subjects are summarized in the top panel of Table 1. Overall, the sample reflected a wide range of SDB severity, with apnea/hypopnea indices ranging from 0.3 to 88.1, though the mean was only 11.2. This result and the skew in the sample toward female subjects probably reflect sleep specialists' tendency to request esophageal pressure monitoring when subtle obstructive sleep apnea or upper airway resistance syndrome are suspected. The mean and standard deviation of frequency-specific RCREC computed over all sleep epochs for the 40 subjects is given in the lower half of Table 1. The RCREC in each frequency range showed no significant correlation with age (each P > 0.10), and no association with sex (P > 0.40). With only one exception, RCREC in each frequency range showed no association (Wilcoxon rank sum test, P > 0.05) with specific classes of medications taken by sufficient numbers of subjects (≥ 5) to allow statistical consideration. These agents included those most commonly used for depression (i.e., antidepressants, taken by n = 15 subjects), reflux (n = 10), asthma (n = 7), pain (opioids, n = 6), diabetes (n = 6), hypertension (n = 12), and hypercholesterolemia (n = 6). The one exception was that beta RCREC was decreased among patients who were taking antidepressant medications (0.046 ± 0.035) in comparison to remaining patients (0.062 ± 0.030, P = 0.02).
Table 1.
Sleep Measures for All 40 Subjects
| Variable | Mean | SD |
|---|---|---|
| Standard Sleep Measures | ||
| Total sleep time (TST, minutes) | 352 | 49 |
| Sleep Efficiency, % (100 * TST/Total Recording Time) | 79 | 10 |
| Stage 1 sleep (% of TST ) | 17 | 11 |
| Stage 2 sleep % | 61 | 14 |
| Stage 3 or 4 sleep % | 6 | 8 |
| Stage REM sleep % | 15 | 7 |
| Apnea / hypopnea index (events per hour of sleep) | 11 | 17 |
| Minimum oxygen saturation (%) | 87 | 6 |
| Epworth Sleepiness Scale score | 11 | 5 |
| Esophageal Pressures (Pes, cm of water, computed) | ||
| Most negative Pes | − 29 | 10 |
| Average Pes | − 14 | 7 |
| Respiratory Cycle-Related EEG Changes (RCREC, mean of 30-sec epoch values) | ||
| Delta RCREC | 0.0855 | 0.0196 |
| Theta RCREC | 0.0599 | 0.0334 |
| Alpha RCREC | 0.0456 | 0.0264 |
| Sigma RCREC | 0.0898 | 0.0469 |
| Beta RCREC | 0.0563 | 0.0322 |
Associations Between ΔPes and RCREC: Within Subjects
A general tendency for RCREC within specific frequency bands to vary with ΔPes is illustrated for one subject in Figure 4. Table 2 shows mean within-subject Spearman correlation coefficients that summarize the magnitude of association between ΔPes values and RCREC during the same 30-s epochs of sleep. Table 2 also indicates what numbers of subjects showed significant (P < 0.05) correlations and significant negative correlations (i.e., in the hypothesized direction), during total sleep time, between the 30-s ΔPes and RCREC values. Sigma RCREC most often showed correlation with ΔPes, and (even more prominently) most often showed negative correlation with ΔPes: this means that higher levels of sigma RCREC were associated with more negative esophageal pressure swings. Within subjects, the variation through the night of ΔPes and RCREC, both averaged over the same 30-s epochs, was most consistent in the sigma band.
Figure 4.
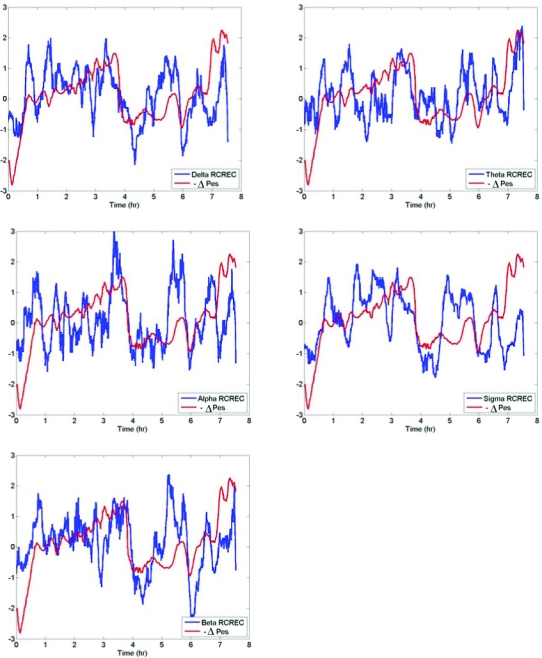
The negative esophageal pressure swings (−ΔPes) are plotted along with the frequency-specific respiratory cycle-related EEG changes (RCREC) computed over an entire night of recording for one subject (21-year-old woman with apnea/hypopnea index = 5.2 and minimum oxygen saturation = 92%). Data were centered and scaled after median filtering. The tendency for the average trend of RCREC to vary with the magnitude of esophageal pressure swings is apparent in this subject.
Table 2.
Within-Subject Correlations, Across All 30-Second Sleep Epochs, Between Esophageal Pressure Swings (Δ Pes) and Respiratory Cycle-Related EEG Changes (RCREC) Within Frequency Band Indicated in First Column
| RCREC Frequency Band | Mean Spearman rho (SD) | No. (%) of 40 subjects who showed statistically significant correlations (P < 0.05) | No. (%) of 40 subjects who showed statistically significant negative correlations (P < 0.05) |
|---|---|---|---|
| Delta | 0.025 (0.082) | 13 (33) | 4 (10) |
| Theta | − 0.008 (0.070) | 14 (35) | 9 (23) |
| Alpha | − 0.018 (0.079) | 8 (20) | 7 (18) |
| Sigma | − 0.124 (0.102) | 30 (75) | 29 (73) |
| Beta | − 0.006 (0.110) | 21 (53) | 12 (30) |
Table 3 shows the number of subjects with significant negative correlations between ΔPes and RCREC within each specified sleep stage. These correlations reached statistical significance more often during stage 2 sleep than during other stages. The tendency for RCREC in sigma, as opposed to other frequency ranges, to correlate best with ΔPes was apparent in stage 1 and stage 2 sleep but not in stage 3 or REM sleep.
Table 3.
Within-Subject Correlations, Across 30-Sec Epochs of Each Sleep Stage, Between Mean Esophageal Pressure Swings (Δ Pes) and Respiratory Cycle-Related EEG Changes (RCREC)
| RCREC Frequency Band | Stage 1 |
Stage 2 |
Stage 3/4 |
Stage REM |
||||
|---|---|---|---|---|---|---|---|---|
| Mean rho (SD) | No. (%) of 40 subjects who showed significant negative correlations (P < 0.05) | Mean rho (SD) | No. (%) of 40 subjects who showed significant negative correlations (P< 0.05) | Mean rho (SD) | No. (%) of 24 subjects* who showed significant negative correlations (P < 0.05) | Mean rho (SD) | No. (%) of 40 subjects who showed significant negative correlations (P < 0.05) | |
| Delta | 0.008 (0.092) | 1 (3) | 0.025 (0.091) | 5 (13) | 0.023 (0.276) | 1 (4) | − 0.006 (0.169) | 2 (5) |
| Theta | − 0.041 (0.135) | 5 (13) | 0.010 (0.080) | 4 (10) | 0.073 (0.314) | 0 (0) | − 0.085 (0.135) | 6 (15) |
| Alpha | − 0.063 (0.112) | 6 (15) | 0.008 (0.095) | 5 (13) | 0.038 (0.332) | 1 (4) | − 0.056 (0.134) | 3 (8) |
| Sigma | − 0.132 (0.122) | 14 (35) | − 0.087 (0.108) | 20 (50) | − 0.040 (0.302) | 2 (8) | − 0.103 (0.162) | 7 (18) |
| Beta | − 0.019 (0.116) | 2 (5) | − 0.007 (0.126) | 10 (25) | 0.071 (0.368) | 3 (13) | − 0.085 (0.201) | 9 (23) |
Only 24 of 40 subjects showed stage 3/4 sleep.
Effects of Time Periods over which ΔPes and RCREC are Compared
Data are presented for the above within-subject analyses based on analyses of 30-s epoch average values for both ΔPes and RCREC. This choice was made in part because traditionally 30-s epochs are considered in sleep stage scoring. However, time periods as short as single breaths or much longer than 30 s can also be considered. Although recapitulation of the above data for several different time frames of reference would be beyond the scope of this paper, results can be summarized descriptively as follows.
Analysis of individual respiratory cycles, in comparison to 30-second epochs, tended to show more significant associations between ΔPes and RCREC, though the magnitudes of the correlations were lower. For example, the correlation between ΔPes and sigma RCREC often ranged from −0.137 to −0.037 (interquartile range, all P < 0.005), in comparison to −0.188 to −0.077 for the 30-s data described above (P < 0.05 for 19 of the 20 subjects). In contrast, time frames > 30 s led to magnified correlations with less significant P-values. For example, analysis of 5-min periods showed a correlation between ΔPes and sigma RCREC of −0.295 to −0.046, with P < 0.05 for only 4 of the 20 subjects.
We believe these differences in magnitudes of correlation reflect gradual reductions in noise as results are averaged over longer time periods. In any case, however, differences in magnitudes of association observed with altered time periods for analysis did not tend to change the relative effectiveness of RCREC in different frequency bands as correlates of ΔPes. Over the time periods considered, more subjects had significant correlations of sigma RCREC, relative to RCREC in other frequency bands, with ΔPes.
Associations Between ΔPes and RCREC: Between Subjects
The average computed ΔPes during all sleep epochs for each of the 40 subjects correlated (inversely) with subjects' average RCREC values within the theta and beta frequency ranges, but not within those for delta, alpha, and sigma frequencies (Table 4). Regression of RCREC on ΔPes showed that each significant Table 4 association persisted (P < 0.05) after adjustment for age and gender. Figure 5 illustrates the relationship between beta RCREC and average computed ΔPes during all sleep epochs.
Table 4.
Spearman rho Correlation Coefficients Between Mean Esophageal Pressure Swings (Δ Pes) for Each Subject and Each Individual's Frequency-Specific Respiratory Cycle-Related EEG Changes (RCREC)
| RCREC frequency range | rho | P-value |
|---|---|---|
| Delta | − 0.001 | 0.994 |
| Theta | − 0.35 | 0.028 |
| Alpha | − 0.19 | 0.237 |
| Sigma | − 0.12 | 0.446 |
| Beta | − 0.56 | 0.0002 |
Figure 5.

Average computed esophageal pressure swings (ΔPes) during all sleep epochs is plotted against beta-frequency respiratory cycle-related EEG changes (RCREC) for each of 40 subjects.
DISCUSSION
Data from 40 adult patients studied with esophageal pressure monitoring for suspected SDB confirm for the first time that respiratory cycle-related EEG changes in sigma EEG frequencies appear to show the most consistent within-subject correlations with the magnitude of negative esophageal pressure swings during sleep. Although many subjects showed statistically significant RCREC in other frequencies, in general the magnitude and direction of the relationship between esophageal pressures swings and EEG power in other frequency ranges were notably less consistent. Much of the tendency for sigma RCREC to increase with more negative esophageal pressures derived from time spent in NREM stages 2 and 1, in contrast to stages 3, 4, and REM sleep. Surprisingly, sigma RCREC did not prove most useful in between-subject analyses: here, theta and particularly beta RCREC correlated inversely, to the strongest degree, with esophageal pressures. These results are largely but not entirely consistent with predictions made on the basis of past investigations into the nature of RCREC. However, these data may provide some insight into potential mechanisms whereby RCREC could contribute to excessive daytime sleepiness in patients with SDB.
Esophageal pressure monitoring is considered a gold-standard measure of work of breathing, but the required esophageal catheter is not used often in clinical practice because many sleep laboratories, particularly those not routinely familiar with its insertion, consider it invasive and likely to disturb sleep despite accumulating evidence to the contrary.12,13 The catheter can engender disproportionate apprehension prior to sleep studies for some patients,18 and in part for this reason considerable interest has arisen in substitute measures that require no esophageal catheter. However, neither esophageal pressures nor potential alternatives, such as nasal pressure monitoring,19 assess the brain's response to the increased work of breathing. This response could be as variable as the work of breathing itself, and potentially could explain why patients with similar levels of sleep apnea often have vastly different levels of sleepiness and related symptoms. To the extent that RCREC may reflect both esophageal pressures and cortical reaction to them, the new measure could offer novel, clinically useful insight without the need for insertion of an esophageal catheter.
Our data thus far suggest that RCREC, particularly in the sigma range, could serve this purpose. In combination with previous work indicating that sigma RCREC are larger in sleep apneics than in non-apneics; improve with SDB treatment; and correlate with sleepiness, the current work may show why. Specifically, this study shows that sigma RCREC, as opposed to RCREC in several other frequency bands, correlate best within single subjects with variations in esophageal pressures throughout sleep. Preliminary work previously suggested that sigma RCREC may be most prominent in stage 2 sleep,20 and current results similarly suggest that RCREC in this stage and stage 1 sleep may be most informative. We can only speculate that in deep NREM sleep, cortical reactivity to work of breathing may be reduced by overwhelming slow wave activity. To the extent that sigma RCREC may be modulated by afferent sensory information concerning the work of breathing, thalamic gating of that information in route to the cortex would be expected to be more complete in deep NREM or REM sleep than in stages 1 or 2.21–23
Given these results, another expected finding in between-subject comparisons would have been that mean sigma RCREC values correlate better than those in other frequencies with mean esophageal pressure swings. Lack of closer correlations potentially could reflect large between-subject variation in the sensitivity of the cortical EEG to augmented respiratory effort. However, this would not explain why RCREC in other frequencies, and particularly the beta range, correlated better than sigma RCREC with esophageal pressure swings in between-subject comparisons. Whereas sigma RCREC could reflect recurrent lightening of sleep with each labored breath, as suggested by previously-demonstrated increases in sigma power during inspiration,9 beta RCREC could reflect increased muscle activity, lightening of sleep, or cognitive activity.24 Why one frequency (sigma) would show the best correlations with ΔPes within individual subjects, but other frequencies (beta and to some extent theta) would show the strongest correlations with ΔPes between subjects cannot be clearly explained at this time by the available data.
Other potential limitations of our data include their retrospective, clinical sources. In this sample we could not rule out potential concern about biological or confounding medication effects, such as that raised by the association detected, among many tested, between beta RCREC and antidepressant use. All patients were referred for suspected SDB, and confounding differences between recordings could include night-to-night biological variability in SDB severity, or first-night effects, though these would be issues for all clinical studies, which cannot accommodate adjustment nights prior to collection of data. A correlative study such as ours cannot prove cause and effect. We developed a new automated measure of esophageal pressure swings, to facilitate measurement of nearly all respiratory cycles during sleep. However, we also provided reasonable evidence that the new measure corresponds closely to human visual scoring of esophageal pressures for clinical purposes in a large, accredited academic sleep laboratory. Finally, in order to compute RCREC and ΔPes for the same respiratory cycles, we used a smoothed ΔPes signal instead of airflow to identify and partition respiratory cycles. However, this deviation from our previous procedure is not likely to have reduced the effectiveness of the RCREC calculations, as substitution of chest excursion for thermocouple-generated airflow signals did not hamper detection of statistically significant RCREC in the past.7
In short, current data from patients suspected to have SDB and studied for clinical purposes with esophageal pressure monitoring suggest that RCREC within those frequencies (sigma) previously found to best predict excessive daytime sleepiness also seem to correlate most closely, at least within individual subjects, with negative esophageal pressure swings that reflect increased work of breathing. In contrast, sigma RCREC do not distinguish between subjects with high or low ΔPes, though RCREC in other frequencies, and particularly the beta range, appear to be useful in this manner. Reasons for the discrepancy remain unclear at this time. Our results do not provide proof, but again seem to support the hypothesis that in response to increased work of breathing the RCREC reflect subtle cortical inspiratory microarousals, activation, or perhaps central nervous system reactions that maintain sleep. Lightening of sleep, on average, with inspiration would seem to favor microarousal.9 However, available data also cannot rule out the possibility that efferent rather than afferent processes, such as any possible cortical influences on respiration or airway resistance, are responsible for RCREC. Prospective research designs in which upper airway resistance is increased or decreased mechanically during sleep may help to clarify cause-and-effect relationships in the future, as might study of additional SDB-sensitive outcomes besides sleepiness.
ACKNOWLEDGMENTS
Support for this study was provided by HL080941. This work was performed at the University of Michigan and Michigan Tech Research Institute, Ann Arbor, Michigan
Footnotes
Disclosure Statement
This was not an industry supported study. Dr. Chervin is on the advisory board and has financial interests in Pavad Medical; was compensated as a roundtable discussion participant by Respironics; and is developer, in part, of an algorithm that calculates respiratory cycle-related EEG changes. Patent is owned by the University of Michigan and Michigan Technological University. Dr. Malhotra is on the speaker's bureau of Boehringer-Ingelheim and Sepracor. Dr. Burns was involved in projects not related to sleep research for which Michigan Technological University received funding form Science Applications International Corporation and ElectroSonics Medical. He is co-inventor of a patent related to respiratory cycle-related EEG changes technique. The patent is owned by the University of Michigan and Michigan Technological University.
REFERENCES
- 1.Chervin RD, Kraemer HC, Guilleminault C. Correlates of sleep latency on the multiple sleep latency test in a clinical population. Electroencephalogr clin Neurophysiol. 1995;95:147–53. doi: 10.1016/0013-4694(95)00075-a. [DOI] [PubMed] [Google Scholar]
- 2.Chervin RD, Guilleminault C. Assessment of sleepiness in clinical practice. Nature Med. 1995;1:1252–3. doi: 10.1038/nm1295-1252. [DOI] [PubMed] [Google Scholar]
- 3.Chervin RD, Aldrich MS. Characteristics of apneas and hypopneas during sleep and relation to excessive daytime sleepiness. Sleep. 1998;21:799–806. [PubMed] [Google Scholar]
- 4.Chervin RD, Aldrich MS. The Epworth Sleepiness Scale may not reflect objective measures of sleepiness or sleep apnea. Neurology. 1999;52:125–31. doi: 10.1212/wnl.52.1.125. [DOI] [PubMed] [Google Scholar]
- 5.Kushida CA, Giacomini A, Lee MK, Guilleminault C, Dement WC. Technical protocol for the use of esophageal manometry in the diagnosis of sleep-related breathing disorders. Sleep Med. 2002;3:163–73. doi: 10.1016/s1389-9457(01)00143-5. [DOI] [PubMed] [Google Scholar]
- 6.Guilleminault C, Stoohs R, Clerk A, Simmons J, Labanowski M. Excessive daytime somnolence in women with abnormal respiratory efforts during sleep. Sleep. 1993;16:S137–S138. doi: 10.1093/sleep/16.suppl_8.s137. [DOI] [PubMed] [Google Scholar]
- 7.Chervin RD, Burns JW, Subotic NS, Roussi C, Thelen B, Ruzicka DL. Method for detection of respiratory cycle-related EEG changes in sleep-disordered breathing. Sleep. 2004;27:110–15. doi: 10.1093/sleep/27.1.110. [DOI] [PubMed] [Google Scholar]
- 8.Chervin RD, Burns JW, Subotic NS, Roussi C, Thelen B, Ruzicka DL. Correlates of respiratory cycle-related EEG changes in children with sleep-disordered breathing. Sleep. 2004;27:116–21. doi: 10.1093/sleep/27.1.116. [DOI] [PubMed] [Google Scholar]
- 9.Chervin RD, Burns JW, Ruzicka DL. Electroencephalographic changes during respiratory cycles predict sleepiness in sleep apnea. Am J Resp Crit Care Med. 2005;171:652–8. doi: 10.1164/rccm.200408-1056OC. [DOI] [PubMed] [Google Scholar]
- 10.Chervin RD, Weatherly RA, Ruzicka DL, et al. Subjective sleepiness and polysomnographic correlates in children scheduled for adenotonsillectomy vs. other surgical care. Sleep. 2006;29:495–503. [PMC free article] [PubMed] [Google Scholar]
- 11.Chervin RD, Giordani B, Ruzicka DL, et al. Polysomnographic findings and behavior in children scheduled for adenotonsillectomy or hernia repair. Sleep. 2002;25:A431. [Google Scholar]
- 12.Chervin RD, Aldrich MS. Effects of esophageal pressure monitoring on sleep architecture. Am J Resp Crit Care Med. 1997;156:881–885. doi: 10.1164/ajrccm.156.3.9701021. [DOI] [PubMed] [Google Scholar]
- 13.Skatvedt O, Akre H, Godtlibsen OB. Nocturnal polysomnography with and without continuous pharyngeal and esophageal pressure measurements. Sleep. 1996;19:485–90. doi: 10.1093/sleep/19.6.485. [DOI] [PubMed] [Google Scholar]
- 14.Rechtschaffen A, Kales A. Los Angeles: Brain Information Service/ Brain Research Institute, UCLA; 1968. A manual of standardized terminology, techniques and scoring system for sleep stages of human subjects. [Google Scholar]
- 15.Guilleminault C, Stoohs R, Clerk A, Cetel M, Maistros P. A cause of excessive daytime sleepiness: the upper airway resistance syndrome. Chest. 1993;104:781–7. doi: 10.1378/chest.104.3.781. [DOI] [PubMed] [Google Scholar]
- 16.American Academy of Sleep Medicine Task Force. Sleep-related breathing disorders in adults: Recommendations for syndrome definition and measurement techniques in clinical research. Sleep. 1999;22:667–89. [PubMed] [Google Scholar]
- 17.Iber C, Ancoli-Israel S, Chesson A, Quan SF. for the American Academy of Sleep Medicine. Westchester, IL: American Academy of Sleep Medicine; 2007. The AASM manual for the scoring of sleep and associated events: rules, terminology and technical specifications. [Google Scholar]
- 18.Chervin RD, Ruzicka DL, Wiebelhaus JL, et al. Tolerance of esophageal pressure monitoring during polysomnography in children. Sleep. 2003;26:1022–6. doi: 10.1093/sleep/26.8.1022. [DOI] [PubMed] [Google Scholar]
- 19.Ayappa I, Norman RG, Krieger AC, Rosen A, O'malley RL, Rapoport DM. Non-Invasive detection of respiratory effort-related arousals (RERAs) by a nasal cannula/pressure transducer system. Sleep. 2000;23:763–71. doi: 10.1093/sleep/23.6.763. [DOI] [PubMed] [Google Scholar]
- 20.Burns JW, Ruzicka DL, Chervin RD. Respiratory cycle-related EEG changes (RCREC) during specific sleep stages. Sleep. 2005;28:A186. [Google Scholar]
- 21.McCormick DA, Bal T. Sensory gating mechanisms of the thalamus. Curr Opin Neurobiol. 1994;4:550–556. doi: 10.1016/0959-4388(94)90056-6. [DOI] [PubMed] [Google Scholar]
- 22.Cairns BE, McErlane SA, Fragoso MC, Jia WG, Soja PJ. Spontaneous discharge and peripherally evoked orofacial responses of trigemino-thalamic tract neurons during wakefulness and sleep. J Neurosci. 1996;16:8149–59. doi: 10.1523/JNEUROSCI.16-24-08149.1996. [DOI] [PMC free article] [PubMed] [Google Scholar]
- 23.Bazhenov M, Timofeev I, Steriade M, Sejnowski TJ. Model of thalamocortical slow-wave sleep oscillations and transitions to activated states. J Neurosci. 2002;22:8691–704. doi: 10.1523/JNEUROSCI.22-19-08691.2002. [DOI] [PMC free article] [PubMed] [Google Scholar]
- 24.Perlis ML, Smith MT, Andrews PJ, Orff H, Giles DE. Beta/gamma EEG activity in patients with primary and secondary insomnia and good sleeper controls. Sleep. 2001;24:110–17. doi: 10.1093/sleep/24.1.110. [DOI] [PubMed] [Google Scholar]