
Figure 1. Growth on fibroblast-derived 3D matrix differentially regulates proliferation of a panel of human cancer cell lines.
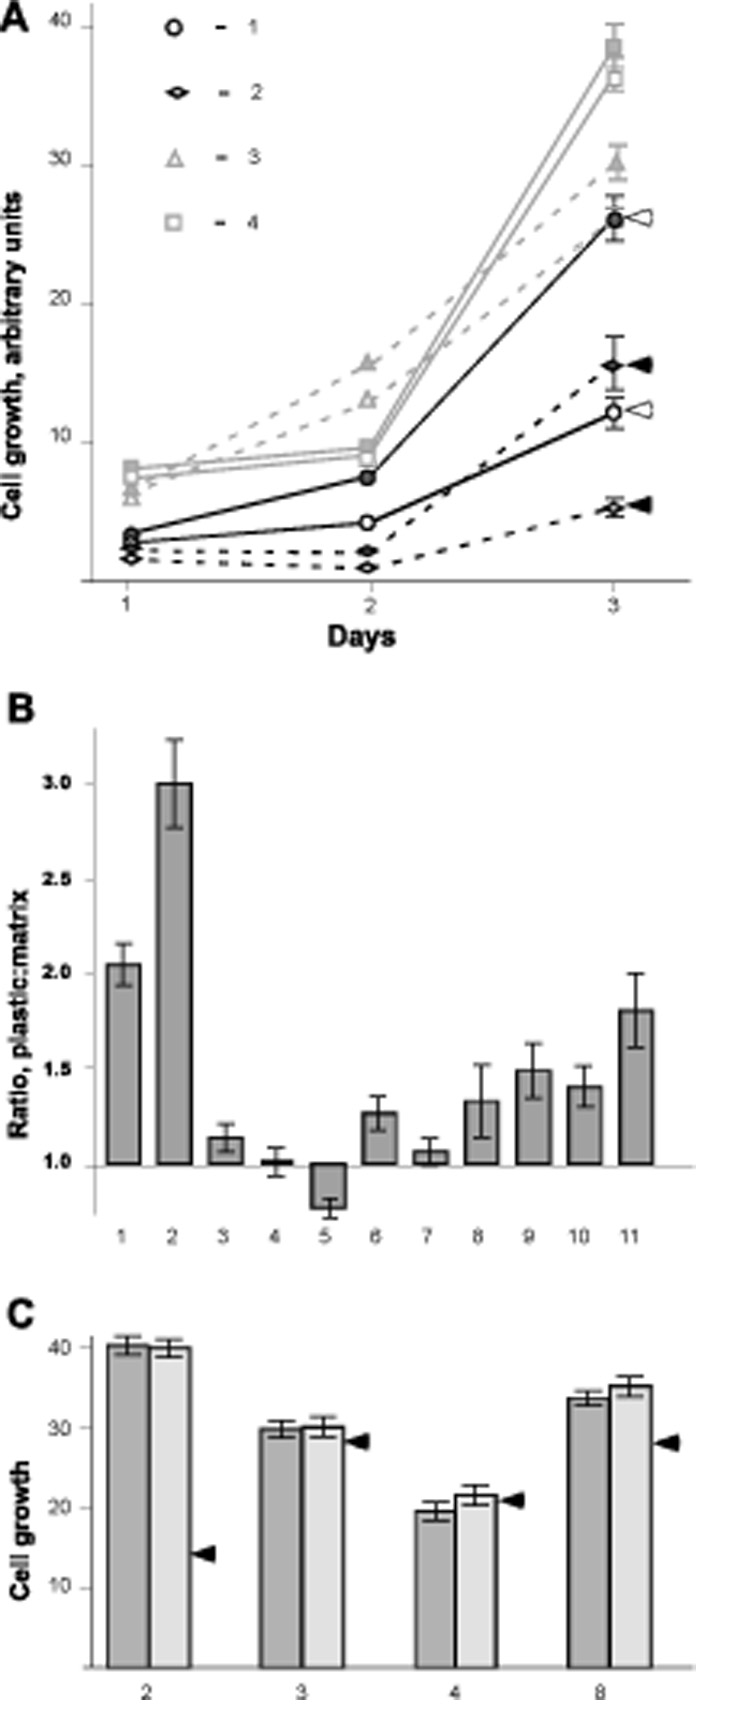
A. Growth of cell lines for 3 days following plating at a density of 2000 cells/well on NIH3T3 cell-derived 3D matrix or tissue culture plastic, prepared as in (Cukierman, 2002; Cukierman, 2005). Assays were run in 96 well plates. Conditions were tested in triplicate, and experiments were repeated three times independently. Results of one typical experiment are shown. Cell numbers were measured by Alamar Blue assay (Invitrogen) following manufacturer’s instructions. Squares indicate COLO 205; triangles, PA-1; circles, HCT116; diamonds, NCI-H460 cells. Filled icons indicate cells grown on plastic while open icons indicate cells grown onto 3D matrix. Arrows designate cell lines with proliferation significantly influenced by growth on 3D matrix. B. The relative proliferation ratio of cells on 3D matrix versus tissue culture plastic at day three after plating is shown. Ratios were calculated as (proliferation rate on plastic) / (proliferation rate onto matrix) as determined by Alamar Blue assay, and expressed in arbitrary units with background subtracted. On average, 4 experiments were performed for each cell line, with each cell line assessed in triplicate in each experiment. Cells shown are: 1, HCT116; 2, NCI-H460; 3, PA-1; 4, COLO 205; 5, PANC-1; 6, MCF7; 7, SW620; 8, HCT116/p53-; 9, HS 578T; 10, PA-1/E6; and 11, MCF10A. C. Relative proliferation of selected cell lines plated on 2D uncoated plastic (dark bars) versus onto plastic pre-coated with solubilized NIH3T3-derived matrix (light bars), to produce 2D matrix conditions as described in (Beacham et al., 2006; Cukierman, 2002; Cukierman et al., 2001). The arrows represent the relative level of proliferation for the given cell line on 3D matrix. Note that these values were extrapolated from the ratios observed in B and are shown with the purpose of comparing the two 2D conditions to the 3D matrix values. Numbers correspond to cell lines as in B.