
Figure 5. Fibroblast-derived 3D matrix selectively regulates human cancer cell responses to drugs.
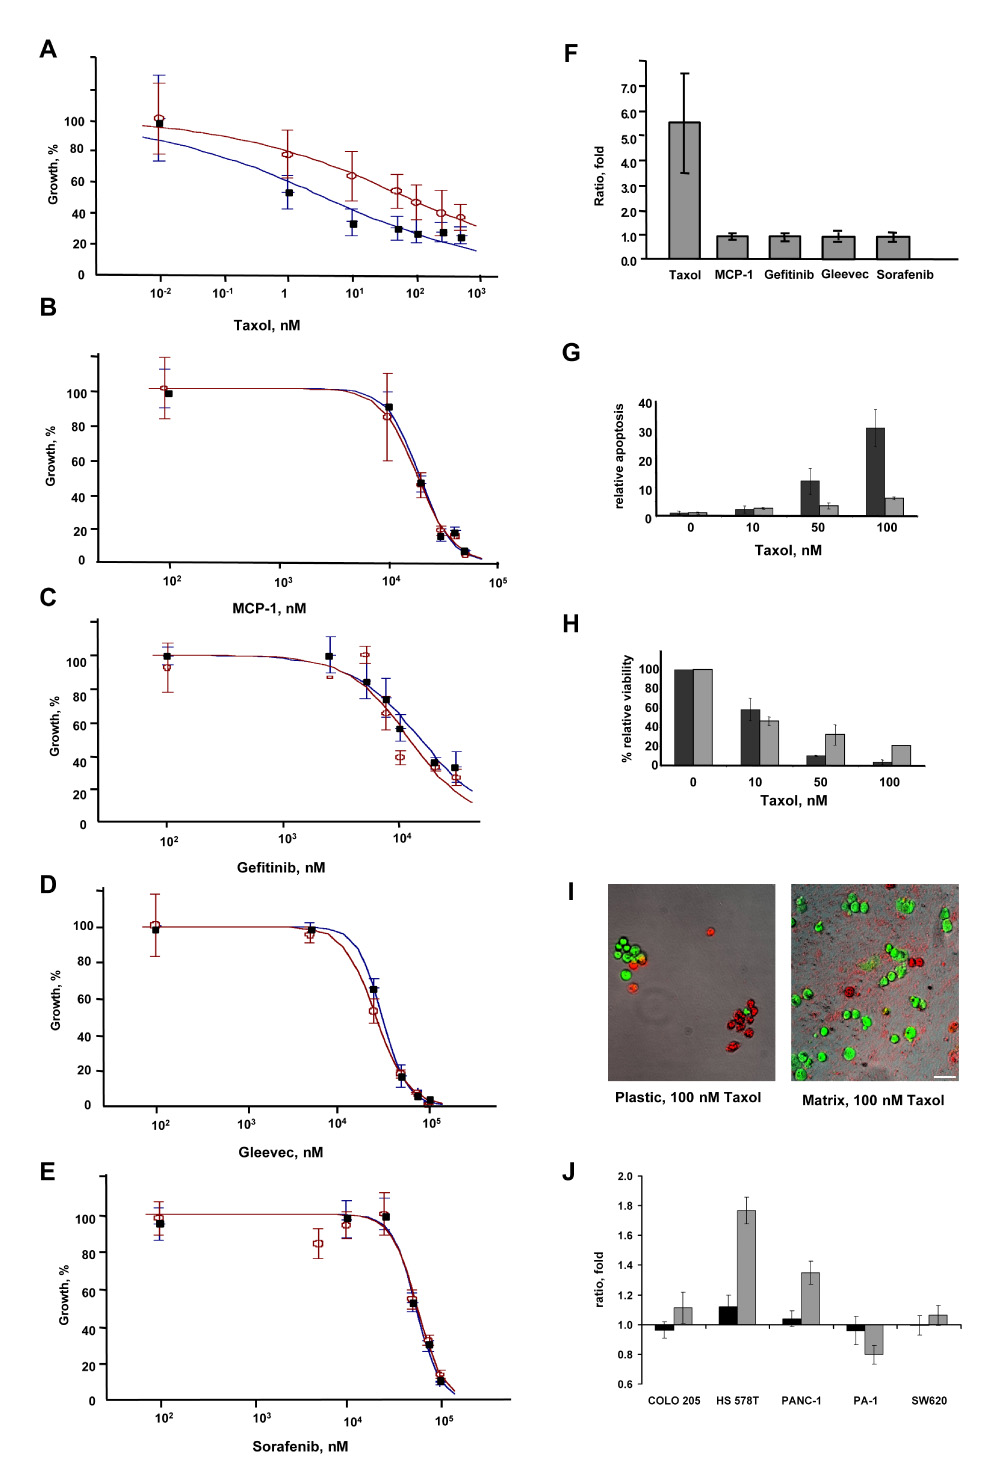
PANC-1 cells were grown on 3D matrix (open circles) or tissue culture plastic (closed circles), and treated with drugs at the concentrations indicated. IC50 calculation was done using Excelfit software. Drugs assessed included A, Taxol B, MCP-1, C, Gefitinib, D, Gleevec, and E, Sorafenib. F. Ratios of IC50 values (matrix:plastic) for PANC-1 cells grown on 3D matrix versus on plastic, 3 days after treatment with drugs are indicated. Results of three separate experiments performed in triplicate are shown. G, H. Apoptosis (G) and total cell number (H) were measured simultaneously on plastic (dark bars) or onto 3D matrix (light bars) using the APOPercentage kit (Biocolor, Co, UK) in conjunction with 0.5 Calcein AM to score total cell numbers (following the manufacturer’s indications, Invitrogen). The relative rate of apoptosis was calculated utilizing digital analyses obtained from MetaMorph 6.3; the percentage shown corresponds to total count (viable plus apoptotic cell areas; shown as green and red in I below) divided by apoptotic cell areas (red in I). I. Representative images of PANC-1 cells grown in the presence of 100 nM taxol for 3 days. Green indicates Calcein AM metabolic cell staining, while red indicates apoptotic cell areas obtained from APOPercentage dye staining. Images shown are a result of merging both fluorescent color channels and the corresponding transmitted phase contrast. Scale bar, 50 µm. J. Ratios of 2D matrix:plastic (dark bars) or 3D matrix:plastic (light bars) IC50 values for PANC-1, HS 578T, COLO 205, PA-1 and SW620 cells, three days after treatment with taxol. Results of three separate experiments performed in triplicate are shown.