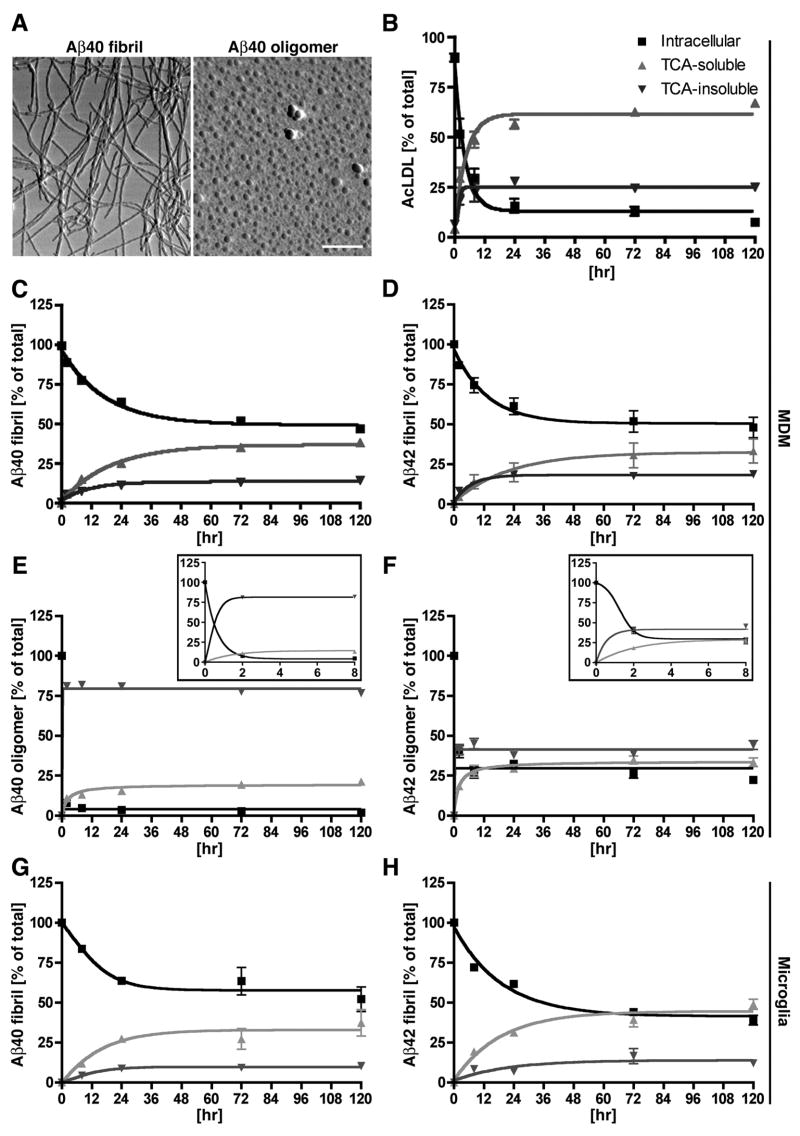
FIGURE 1. AcLDL and Aβ phagocytosis in BM-derived macrophages.
A, AFM images of Aβ40 fibrils (left) and oligomers (right). Scale bar, 500 nm. B–F, MDM (500,000 cells/well of 96-well plate) were incubated with 125I-AcLDL (B), 125I-Aβ40 fibril (C), 125I-Aβ42 fibril (D), 125I-Aβ40 oligomer (E) or 125I-Aβ42 oligomer (F) for pulse labeling. After 1 hr incubation, cells were chased with fresh media at 37°C for 0–120 hrs. At each time point, the intracellular (black square), TCA-soluble (light gray triangle; degraded form), and TCA-precipitated (dark gray inverted triangle; intact form) fraction of 125I-AcLDL, 125I-Aβ40 or 125I-Aβ42 in the media was counted and presented as % total count of all fractions at each time point. Insets in E and F are high-magnified areas between 0 to 8 hrs. GH, human microglia (100,000 cells/well of 48-well plate) were incubated with 125I-Aβ40 fibril (G) or 125I-Aβ42 fibril (H), followed by the same procedure as MDM.

