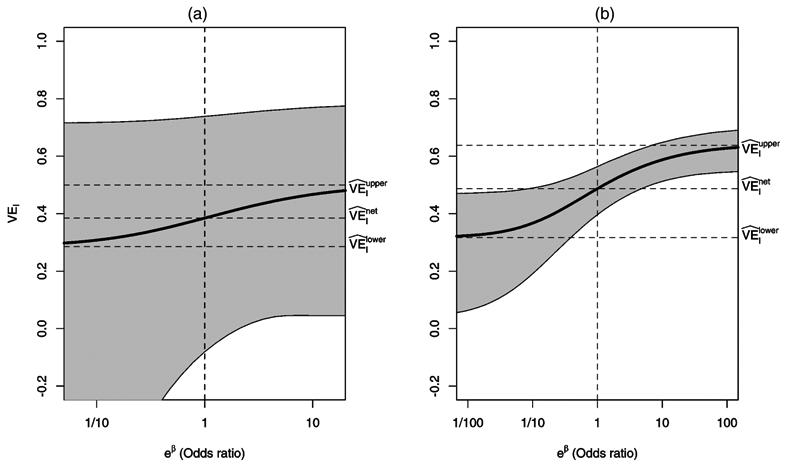
Figure 2.

Sensitivity Analysis Using the Odds Ratio of Having the Severe Postinfection Endpoint Under Placebo in the Doomed versus Protected Principal Strata as Described in Section 4.3.1. (a) Rotavirus; (b) pertussis. The vertical dotted line corresponds to the assumption of no selection bias.
