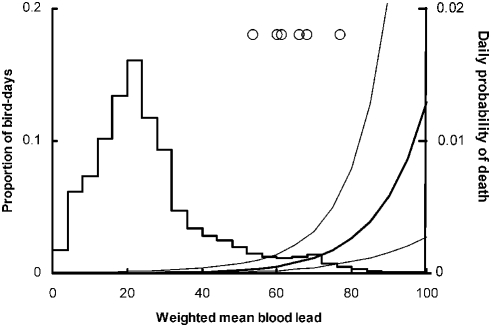
Figure 4. Daily mortality rate of California condors from lead poisoning in relation to the weighted mean of reconstructed blood lead concentration (µg dL−1) prior to the focal day.
The histogram (left-hand scale) shows the distribution of weighted mean blood lead values on days when monitored condors did not die from lead poisoning. Circles show values on the day of death or last capture for the six birds that did die from lead poisoning. The thick curve shows the logistic regression model, fitted to these data, relating daily probability of death (right-hand scale) to the weighted mean of modeled blood lead concentration. Thin curves show 95% bootstrap confidence limits.

