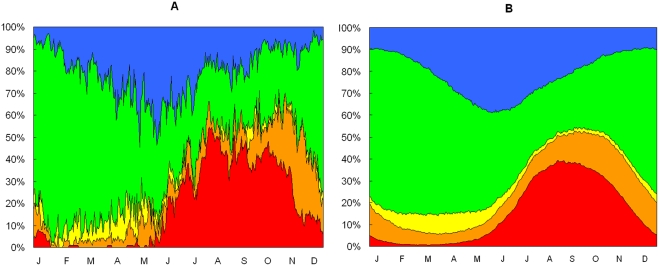
Figure 5. Movements of California condors among zones.
(A) Observed proportions of free-ranging condors in each of five zones (red = North Zone, orange = Kaibab Plateau, yellow = Colorado River Corridor, green = Paria, blue = South Zone) in relation to time of year for observations pooled over the three-year period 2005–2007. (B) Modeled proportions of condors in the same zones from the Markov chain model described in the text.

