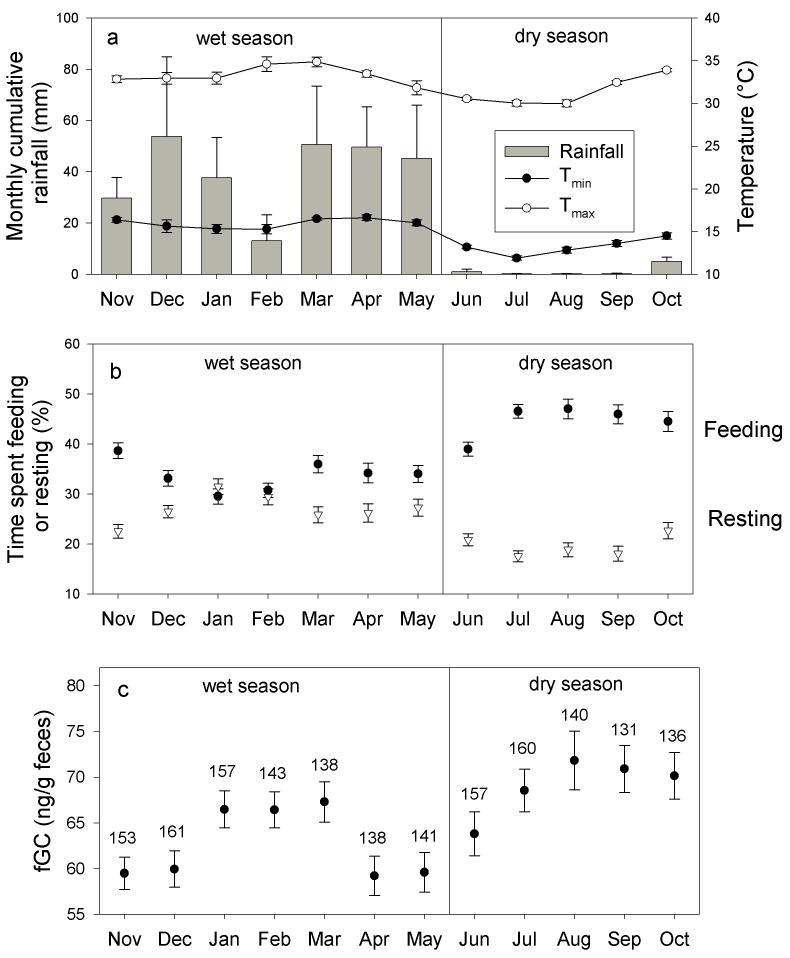
Figure 1.
Monthly and seasonal patterns of (a) Tmin, Tmax and rainfall, (b) proportion of time spent feeding and resting, and (c) fGC. Months are ordered according to ‘hydological year’, beginning with November, the first month of the wet season (as in, e.g., Altmann et al., 2002). (a), each monthly value of Tmin, Tmax and cumulative rainfall represents a mean (± SE) across the 4 years of this study (2002-2005), i.e. N=4 in this case. (b,c), the time spent feeding or resting and fGC represents the mean across female by reproductive state (see Methods). The sample size, N, represents the number of females × reproductive status.

