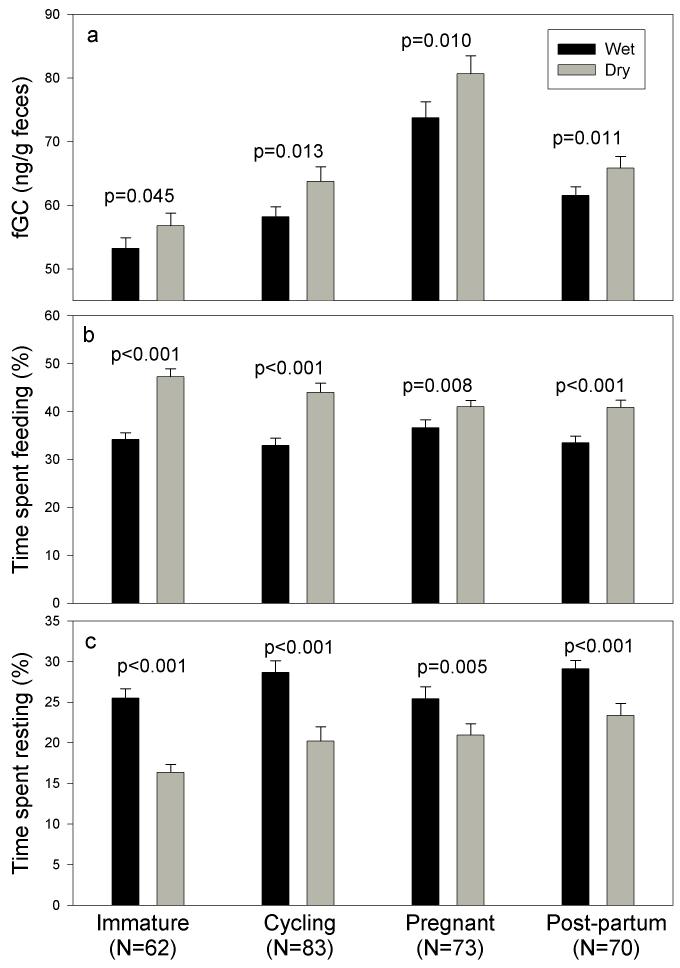
Figure 2.
Comparison of (a) fGC levels, (b) feeding and (c) resting behavior of females for whom data were available in the same reproductive state during both the wet and the dry season. Each value in the graph represents the mean ± SE across females for wet and dry season. N represents the number of females used in the matched paired comparison for each reproductive category. Significance was determined using the Wilcoxon Signed Ranks Test.

