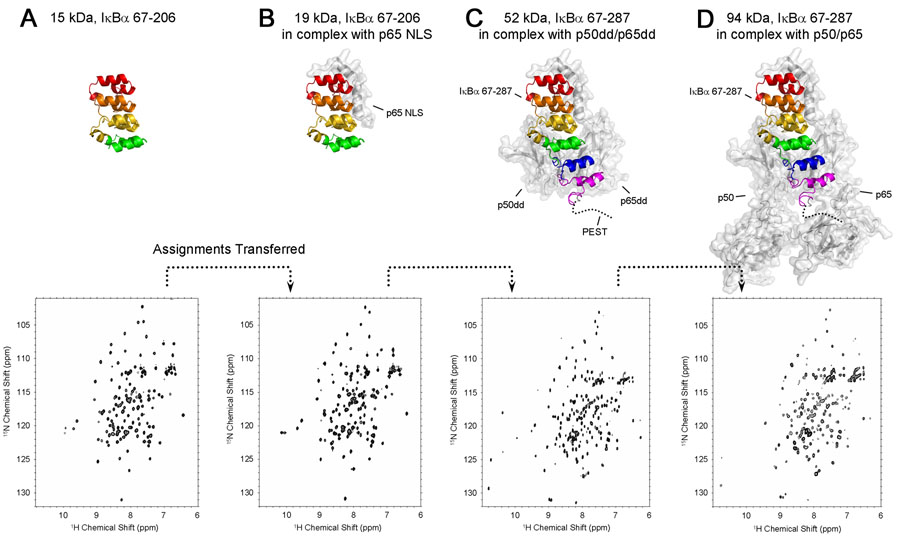
Figure 3.
Schematic diagram showing the assignment strategy for the 94 kDa complex of p50(39-350)/p65(19-321) with IκBα(67-287) based on transfer of assignments from smaller proteins and complexes. The top row shows putative structures of the complexes, modeled from X-ray crystal structures (Jacobs and Harrison, 199810 for A, B, C, D and Chen et al., 199854 for D). The approximate position of the flexible PEST sequence is indicated by a dotted line. Ankyrin repeats are colored red (ANK 1), orange (ANK 2), yellow (ANK 3), green (ANK 4), blue (ANK 5) and purple (ANK 6). The bottom row shows the 600 MHz 1H-15N HSQC spectra (A, B) or 900 MHz TROSY-type HSQCs (C, D) for each IκBα fragment. (A) [2H, 15N, 13C]-labeled IκBα(67-206) (15 kDa), (B) [2H, 15N, 13C]-IκBα(67-206) in complex with p65 NLS (residues 289-321 of human p65) (19 kDa), (C) [2H, 15N, 13C]-IκBα(67-287) in complex with p50(248-350)/p65(190-321) (52 kDa), (D) [2H, 15N, 13C]-IκBα(67-287) in complex with p50(39-350)/p65(19-321). The experimental conditions are 0.5 mM, 20°C, 600 MHz in (A) and (B), 0.5 mM, 25°C, 900 MHz in (C) and 0.1 mM, 30°C, 900 MHz in (D) respectively. The IκBα fragments are 15N, 13C labeled and highly deuterated; p50 and p65 fragments are deuterated only.

