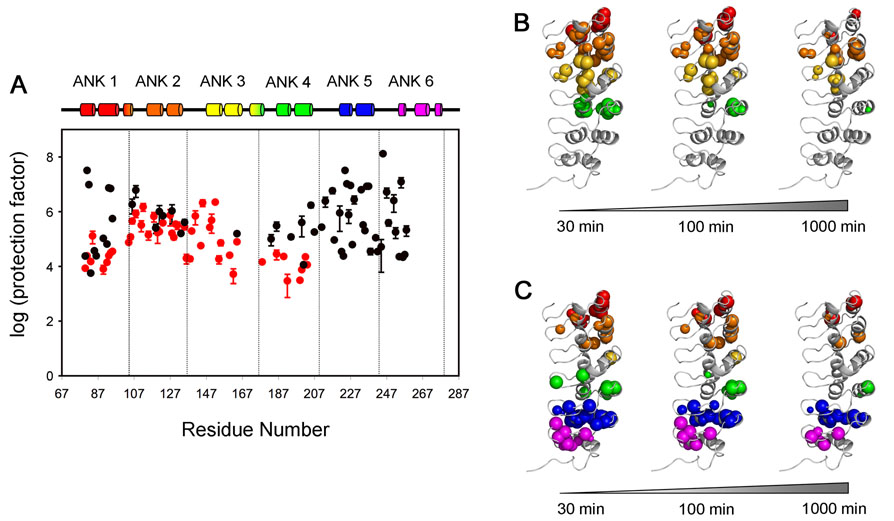
Figure 8.
Protection factors (PF) of IκBα. (A) Profiles show the protection factors of backbone amides of IκBα(67-206) (red) and IκBα(67-287) in complex with p50(248-350)/p65(190-321) (black). PF values were not determined for residues 82, 96, 119 and 148 of free IκBα(67-206), or for residues 84, 91, 96, 129, 178, 202, 232, 239 of IκBα(67-287) in complex with p50(248-350)/p65(190-321), because of resonance overlap. PF values for residues 81, 82, 93, 94, 224, 225, 227, 233, 236 of IκBα(67-287) in complex with p50(248-350)/p65(190-321) represent a lower limit since resonance intensities decay slowly within the experiment time. The experimental exchange rates (kex) for these residues are assumed to be 10−5 min−1 and standard errors are not available. B., C. The amides still present in the HSQC spectrum after various H/D exchange time points (30 min, 100 min and 1000 min) are mapped as spheres onto the published structure of IκBα in the complex.10 B. IκBα(67-206) C. IκBα(67-287) in complex with p50(248-350)/p65(190-321). The radius of each sphere reflects the intensity of the cross peak that remains in the HSQC or TROSY-HSQC spectrum. Experiments were recorded at 20°C, 600 MHz for IκBα(67-206) and 25°C, 900 MHz for IκBα(67-287) in complex with p50(248-350)/p65(190-321).

