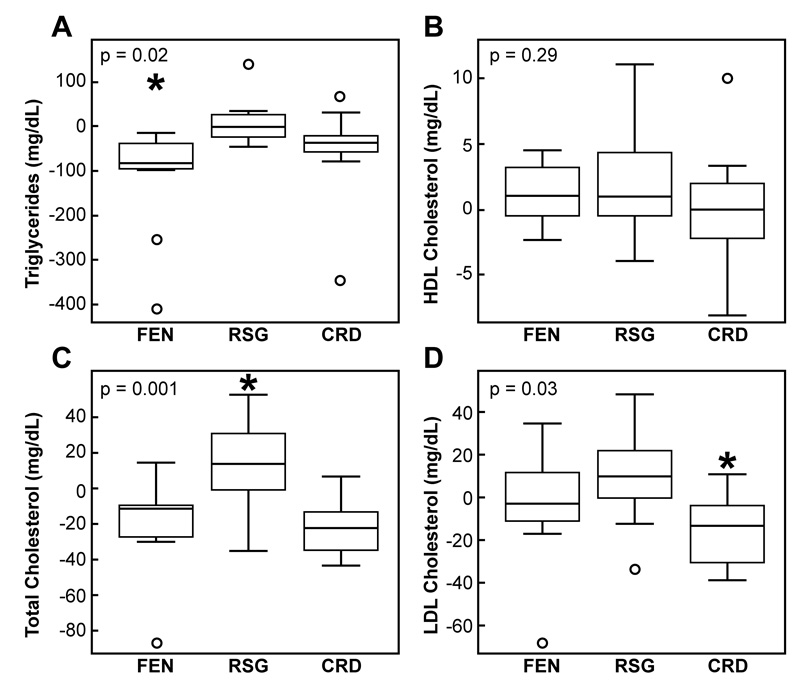
Figure 2.
Comparison of treatment-associated changes (post minus baseline) in fasting lipid and lipoprotein concentrations among the fenofibrate (FEN), rosiglitazone (RSG), or a calorie-restricted diet (CRD) groups.
p value indicates significance of difference among the 3 groups by one-way ANOVA. *Tukey’s pairwise comparisons: A) FEN vs. RSG (p=0.01); C) RSG vs. FEN (p=0.003) and RSG vs. CRD (p=0.001); and D) CRD vs. RSG (p=0.03).

