
Fig. 5. Nonuniform contraction of a tensegrity stress fiber model.
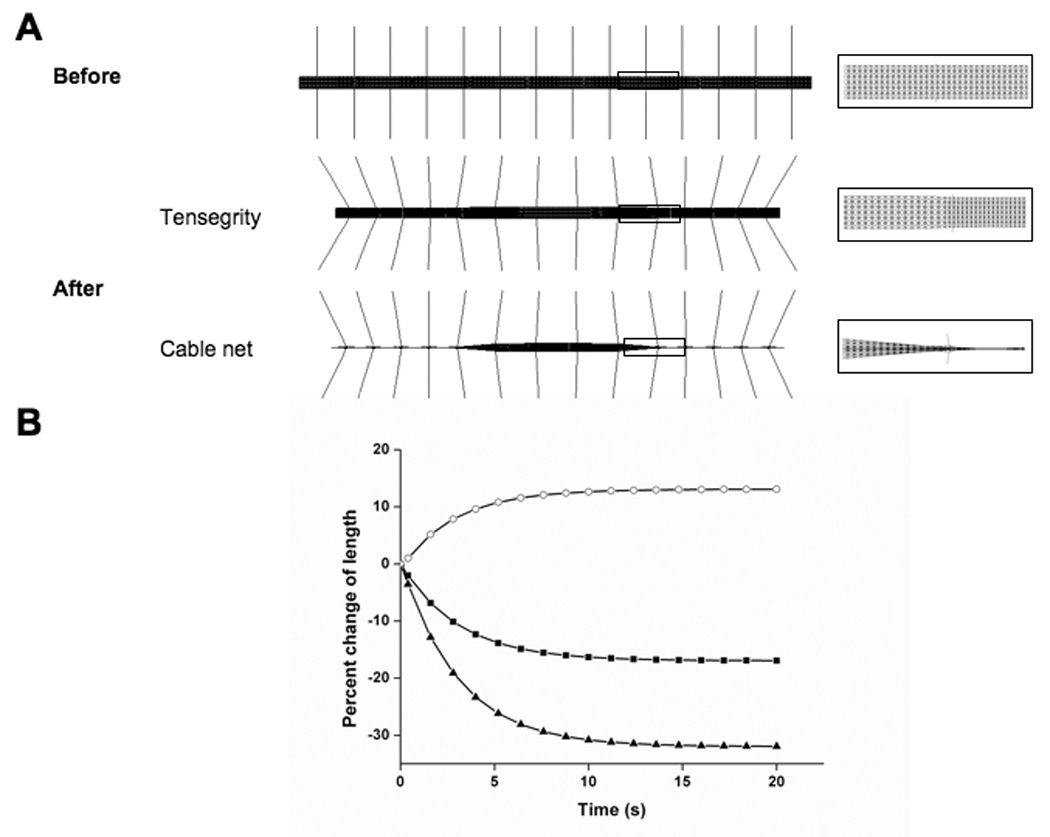
A) Configurations of the tensegrity SF model before (top) and after (bottom) contraction. Enlarged views of the junctions between the peripheral and central regions of the SF pre- and post-contraction are also shown (middle). B and C show percent change in length exhibited by the whole tensegrity structure (black squares) versus the peripheral (black triangles) and central regions (open circles) of the tensegrity model and a tensed cable net model with similar configuration that lacked compression struts, respectively.