Figure 2.
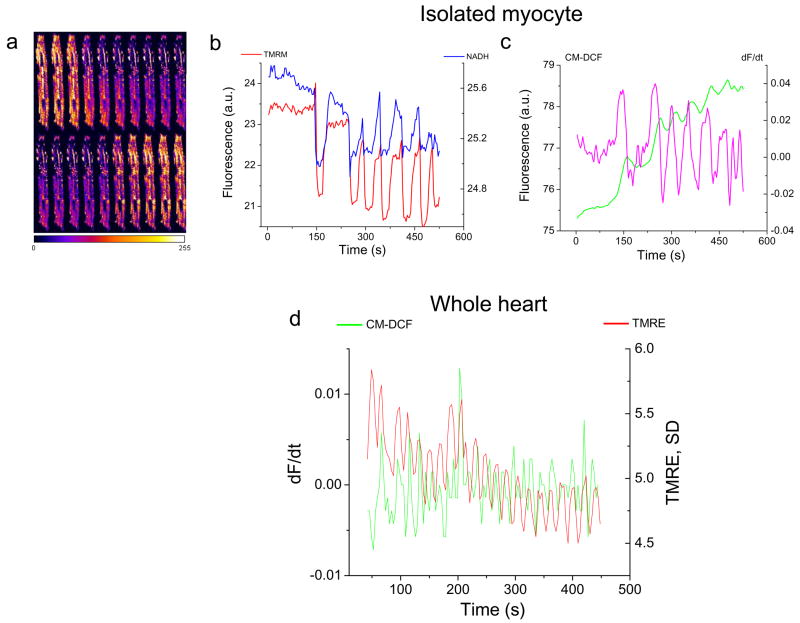
Comparison of ΔΨm oscillations in isolated cardiomyocytes and intact myocardium. a) A montage of TMRE images during an oscillatory cycle in a single isolated cardiomyocyte. b) The phase relationship of ΔΨm (TMRE, red trace) and NADH (blue trace). c) The time course of CM-DCF fluorescence (green trace) for the same myocyte, and its derivative, which represents the rate of ROS production (dF/dt, magenta trace). d) ΔΨm oscillation and the concomitant bursts of ROS produced during each depolarization in one optical field of the intact heart. The red trace shows the variance of the TMRE signal (a measure of ΔΨm heterogeneity) plotted with the derivative of the ROS signal (CM-DCF, green). In this case, the peaks of the variance plot correspond to ΔΨm depolarization, which correlate with increased ROS production.(a.u: arbitrary fluorescence units)

