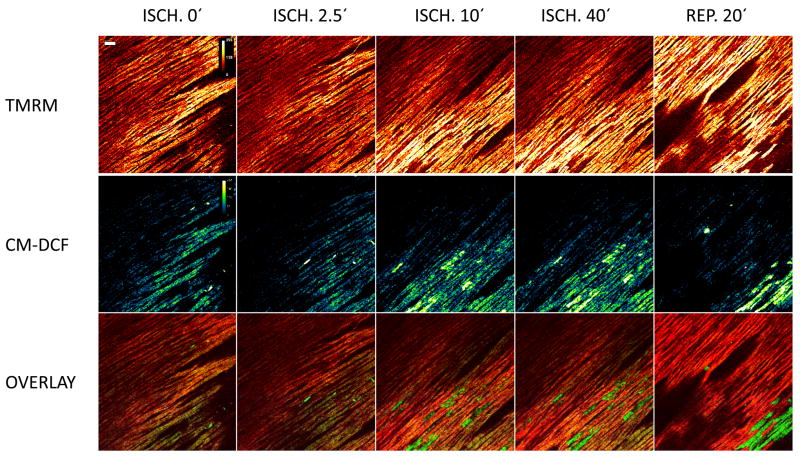
Figure 3.
Regional ischemia induces heterogeneity of ΔΨm and ROS signals. Forty minutes of ischemia, initiated by LAD occlusion, precipitated marked cell-to-cell heterogeneity of ΔΨm (upper (panels) that correlated with oxidative stress (middle panels). As indicated in the overlays (lower panels), the highest levels of CM-DCF fluorescence corresponded to cells with completely depolarized mitochondria, which became more pronounced after reperfusion. Scale bar equals 40 microns. Fluorescence intensity is represented by a pseudocolor lookup table between 0 and 255 units, as indicated.

