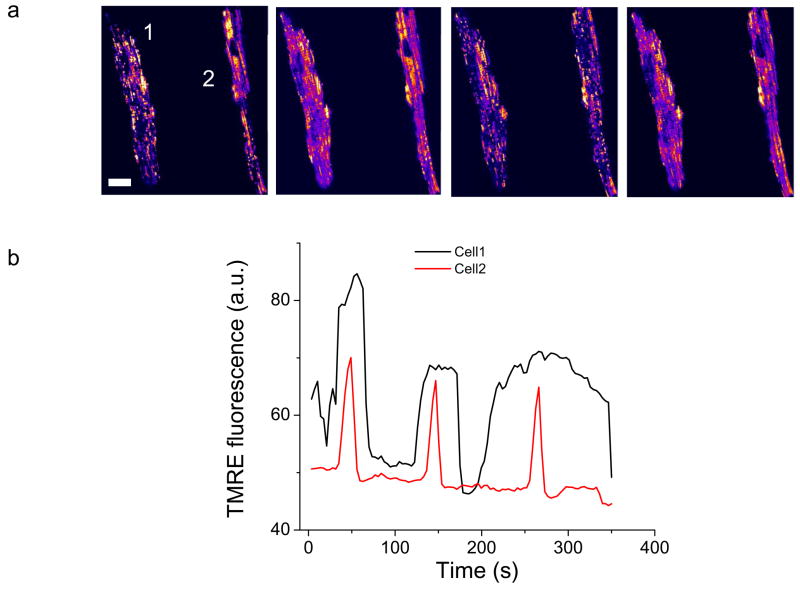
Figure 8.
ΔΨm Oscillations induced by diamide in isolated cardiomyocytes. Freshly isolated cardiomyocytes were treated with 0.1mM diamide in Tyrode’s solution containing 1 mM Ca2+ and imaged by two photon laser scanning fluorescence microscopy. a) TMRE images during different phases of the oscillatory cycle. b) Representative time courses of diamide-induced ΔΨm oscillations in the two separate (unsynchronized) cells. Scale bar in a equals 20 microns

