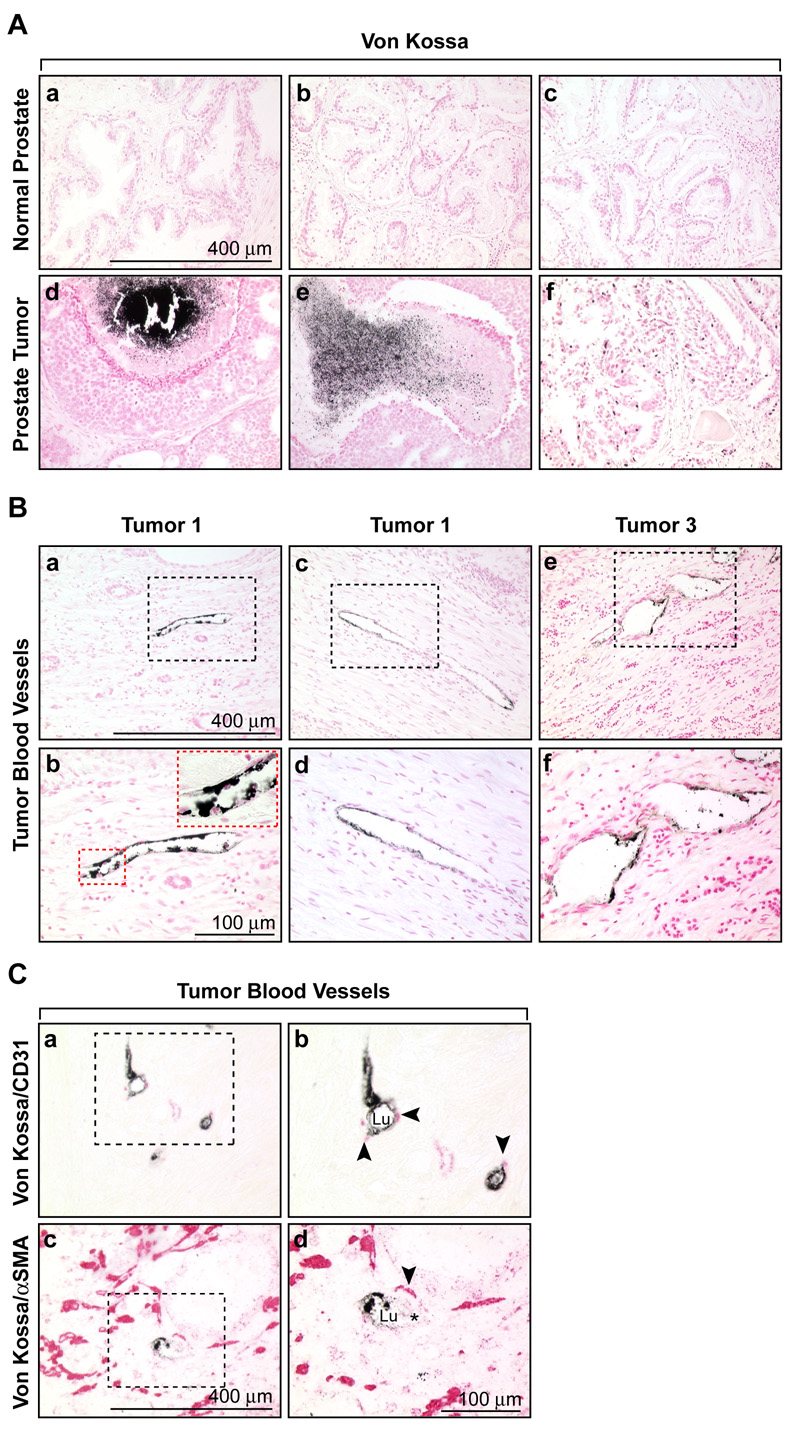
Figure 7. In vivo calcification of prostate tumor cells and vascular cells.
(A) Representative images of Von Kossa staining in normal prostate (a,b,c) and prostate tumors (d,e,f). Calcification in tumors was often associated with highly necrotic regions. (B) Von Kossa staining in tumor blood vessels from three different tumors showing the luminal localization (a,c,e). Boxed regions are shown in higher magnification below (b,d,f). The inset in panel ‘b’ shows a higher magnification of the boxed region. Nuclei in ‘A’ and ‘B’ were counterstained with nuclear fast red. (C) Co-localization of the endothelial marker, CD31 (a,b) and the pericyte marker, α SMA (c,d) with Von Kossa staining in tumor blood vessels. The boxed regions are shown in higher magnification at right. CD31 and α SMA were detected using an alkaline phosphatase-conjugated secondary antibody and appear red in the figure. No counterstain was used. Lu = lumen and the asterisk (*) marks a visible erythrocyte within the vessel lumen in ‘d’.

