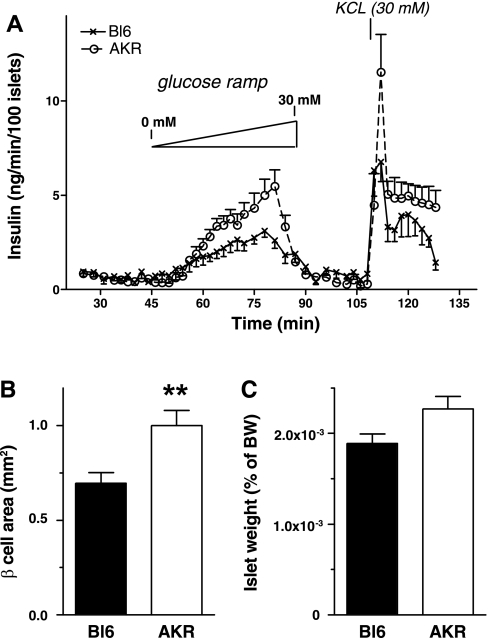
Fig. 3.
A: ex vivo perifusion compared glucose-stimulated insulin secretion from Bl6 islets (×) and AKR islets (○) on NC. Data are means ± SE, n = 5–6. Islet area (B) and islet weight (C) (% of BW) were obtained in Bl6 and AKR on NC as is described in materials and methods. Data are means ± SE, n = 8. **P < 0.01 vs. Bl6.

